Grafana using Prometheus
This guide walks you through the steps required to monitor the performance and overall health of your Materialize instance using Prometheus and Grafana.
Before you begin
Ensure you have:
- A self-managed instance of Materialize installed with helm values
observability.enabled=true,observability.podMetrics.enabled=true, andprometheus.scrapeAnnotations.enabled=true - Helm version 3.2.0+ installed
- kubectl installed and configured
1. Download our Prometheus scrape configurations (prometheus.yml)
Download the Prometheus scrape configurations that we’ll use to configure Prometheus to collect metrics from Materialize:
curl -o prometheus_scrape_configs.yml https://raw.githubusercontent.com/MaterializeInc/materialize/refs/heads/self-managed-docs/v25.2/doc/user/data/monitoring/prometheus.yml
2. Install Prometheus to your Kubernetes cluster
-
Download the prometheus-community default chart values (
values.yaml):curl -O https://raw.githubusercontent.com/prometheus-community/helm-charts/refs/heads/main/charts/prometheus/values.yaml -
Within
values.yaml, replaceserverFiles > prometheus.yml > scrape_configswith our scrape configurations (prometheus_scrape_configs.yml). -
Install the operator with the updated
values.yaml:kubectl create namespace prometheus helm repo add prometheus-community https://prometheus-community.github.io/helm-charts helm repo update helm install --namespace prometheus prometheus prometheus-community/prometheus \ --values values.yaml
3. Optional. Visualize through Grafana
-
Install the Grafana helm chart following this guide.
-
Set up port forwarding to access the Grafana UI:
MZ_POD_GRAFANA=$(kubectl get pods -n monitoring -l app.kubernetes.io/name=grafana -o custom-columns="NAME:.metadata.name" --no-headers)
kubectl port-forward pod/$MZ_POD_GRAFANA 3000:3000 -n monitoring
WARNING! The port forwarding method is for testing purposes only. For production environments, configure an ingress controller to securely expose the Grafana UI. -
Open the Grafana UI on http://localhost:3000 in a browser.
-
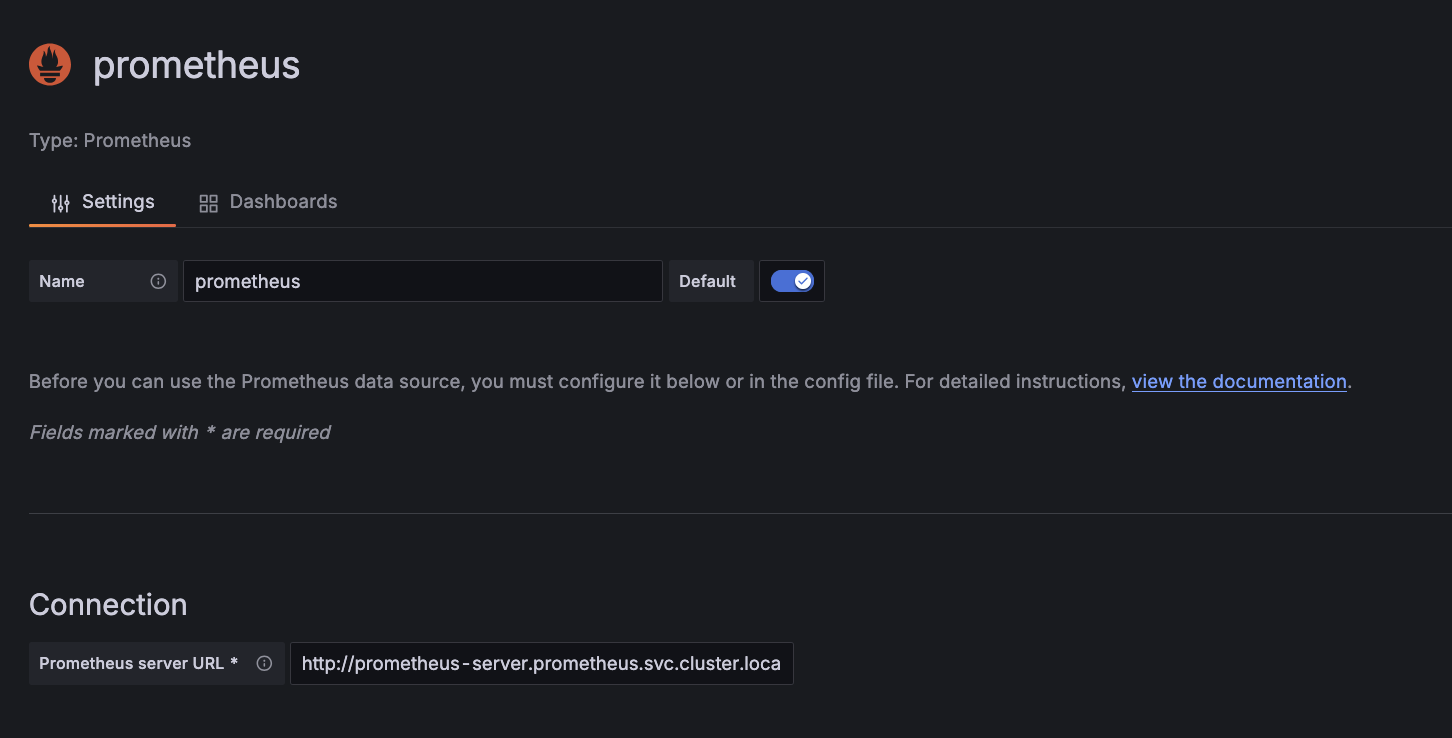
Add a Prometheus data source. In the Grafana UI, under Connection > Data sources,
- Click Add data source and select prometheus
- In the Connection section, set Prometheus server URL to
http://<prometheus server name>.<namespace>.svc.cluster.local:<port>(e.g.http://prometheus-server.prometheus.svc.cluster.local:80).
-
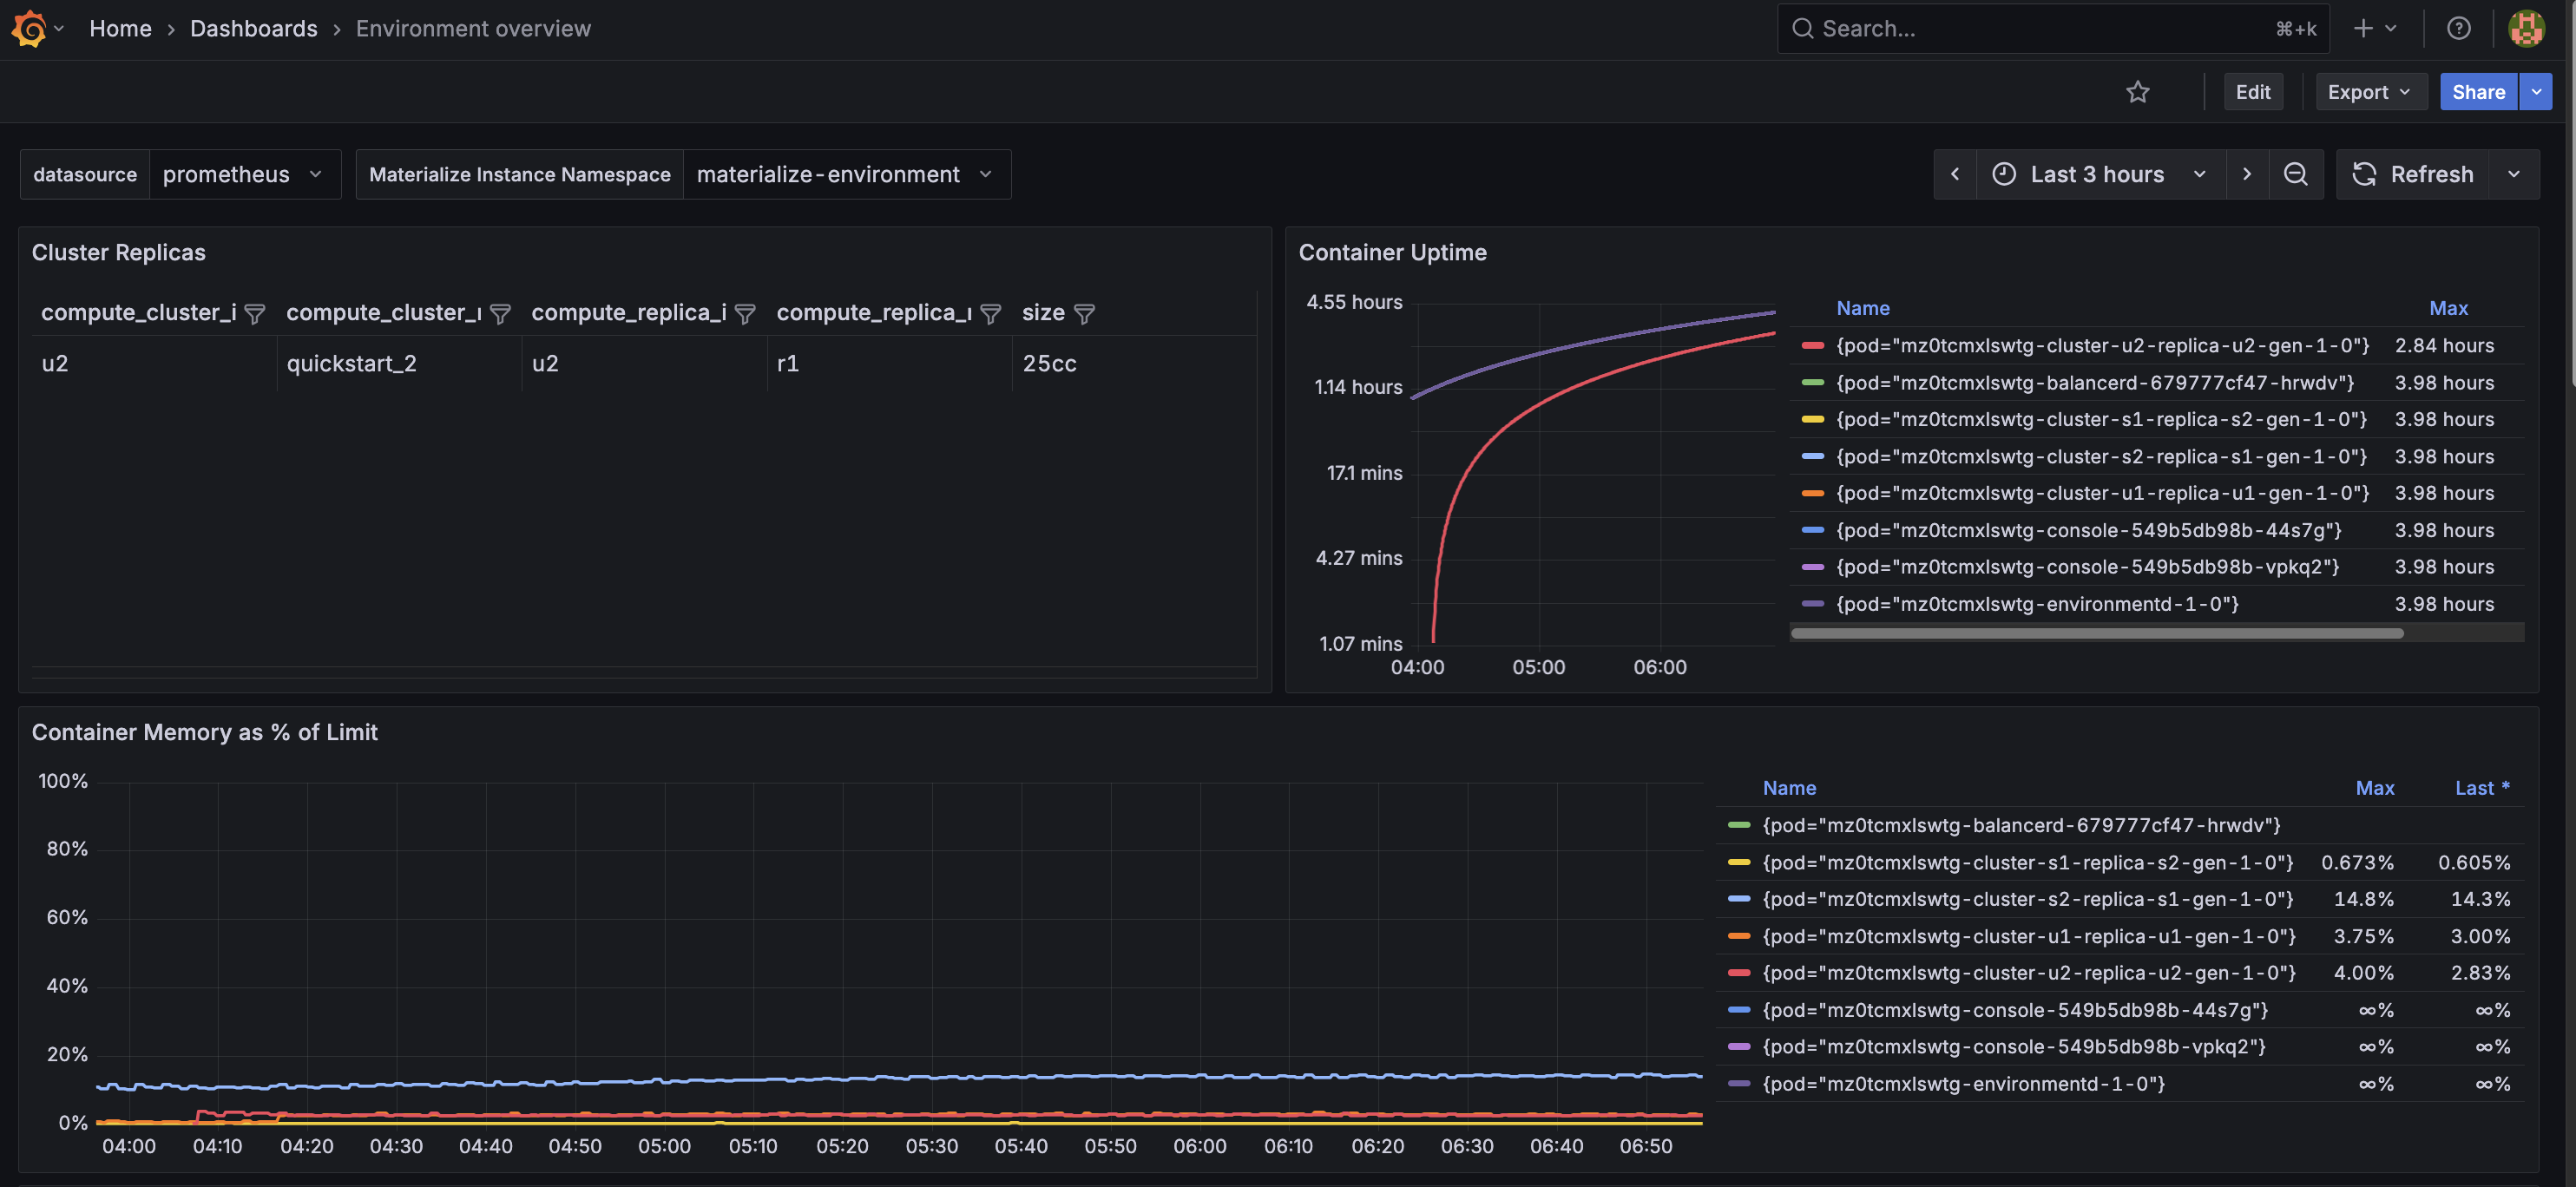
Download the following dashboards:
Environment overview dashboard
An overview of the state of different objects in your environment.
# environment_overview_dashboard.json
curl -O https://raw.githubusercontent.com/MaterializeInc/materialize/refs/heads/self-managed-docs/v25.2/doc/user/data/monitoring/grafana_dashboards/environment_overview_dashboard.json
Freshness overview dashboard
An overview of how out of date objects in your environment are.
# freshness_overview_dashboard.json curl -O https://raw.githubusercontent.com/MaterializeInc/materialize/refs/heads/self-managed-docs/v25.2/doc/user/data/monitoring/grafana_dashboards/freshness_overview_dashboard.json -
Import the dashboards using the Prometheus data source