Introducing Workload Capture & Replay

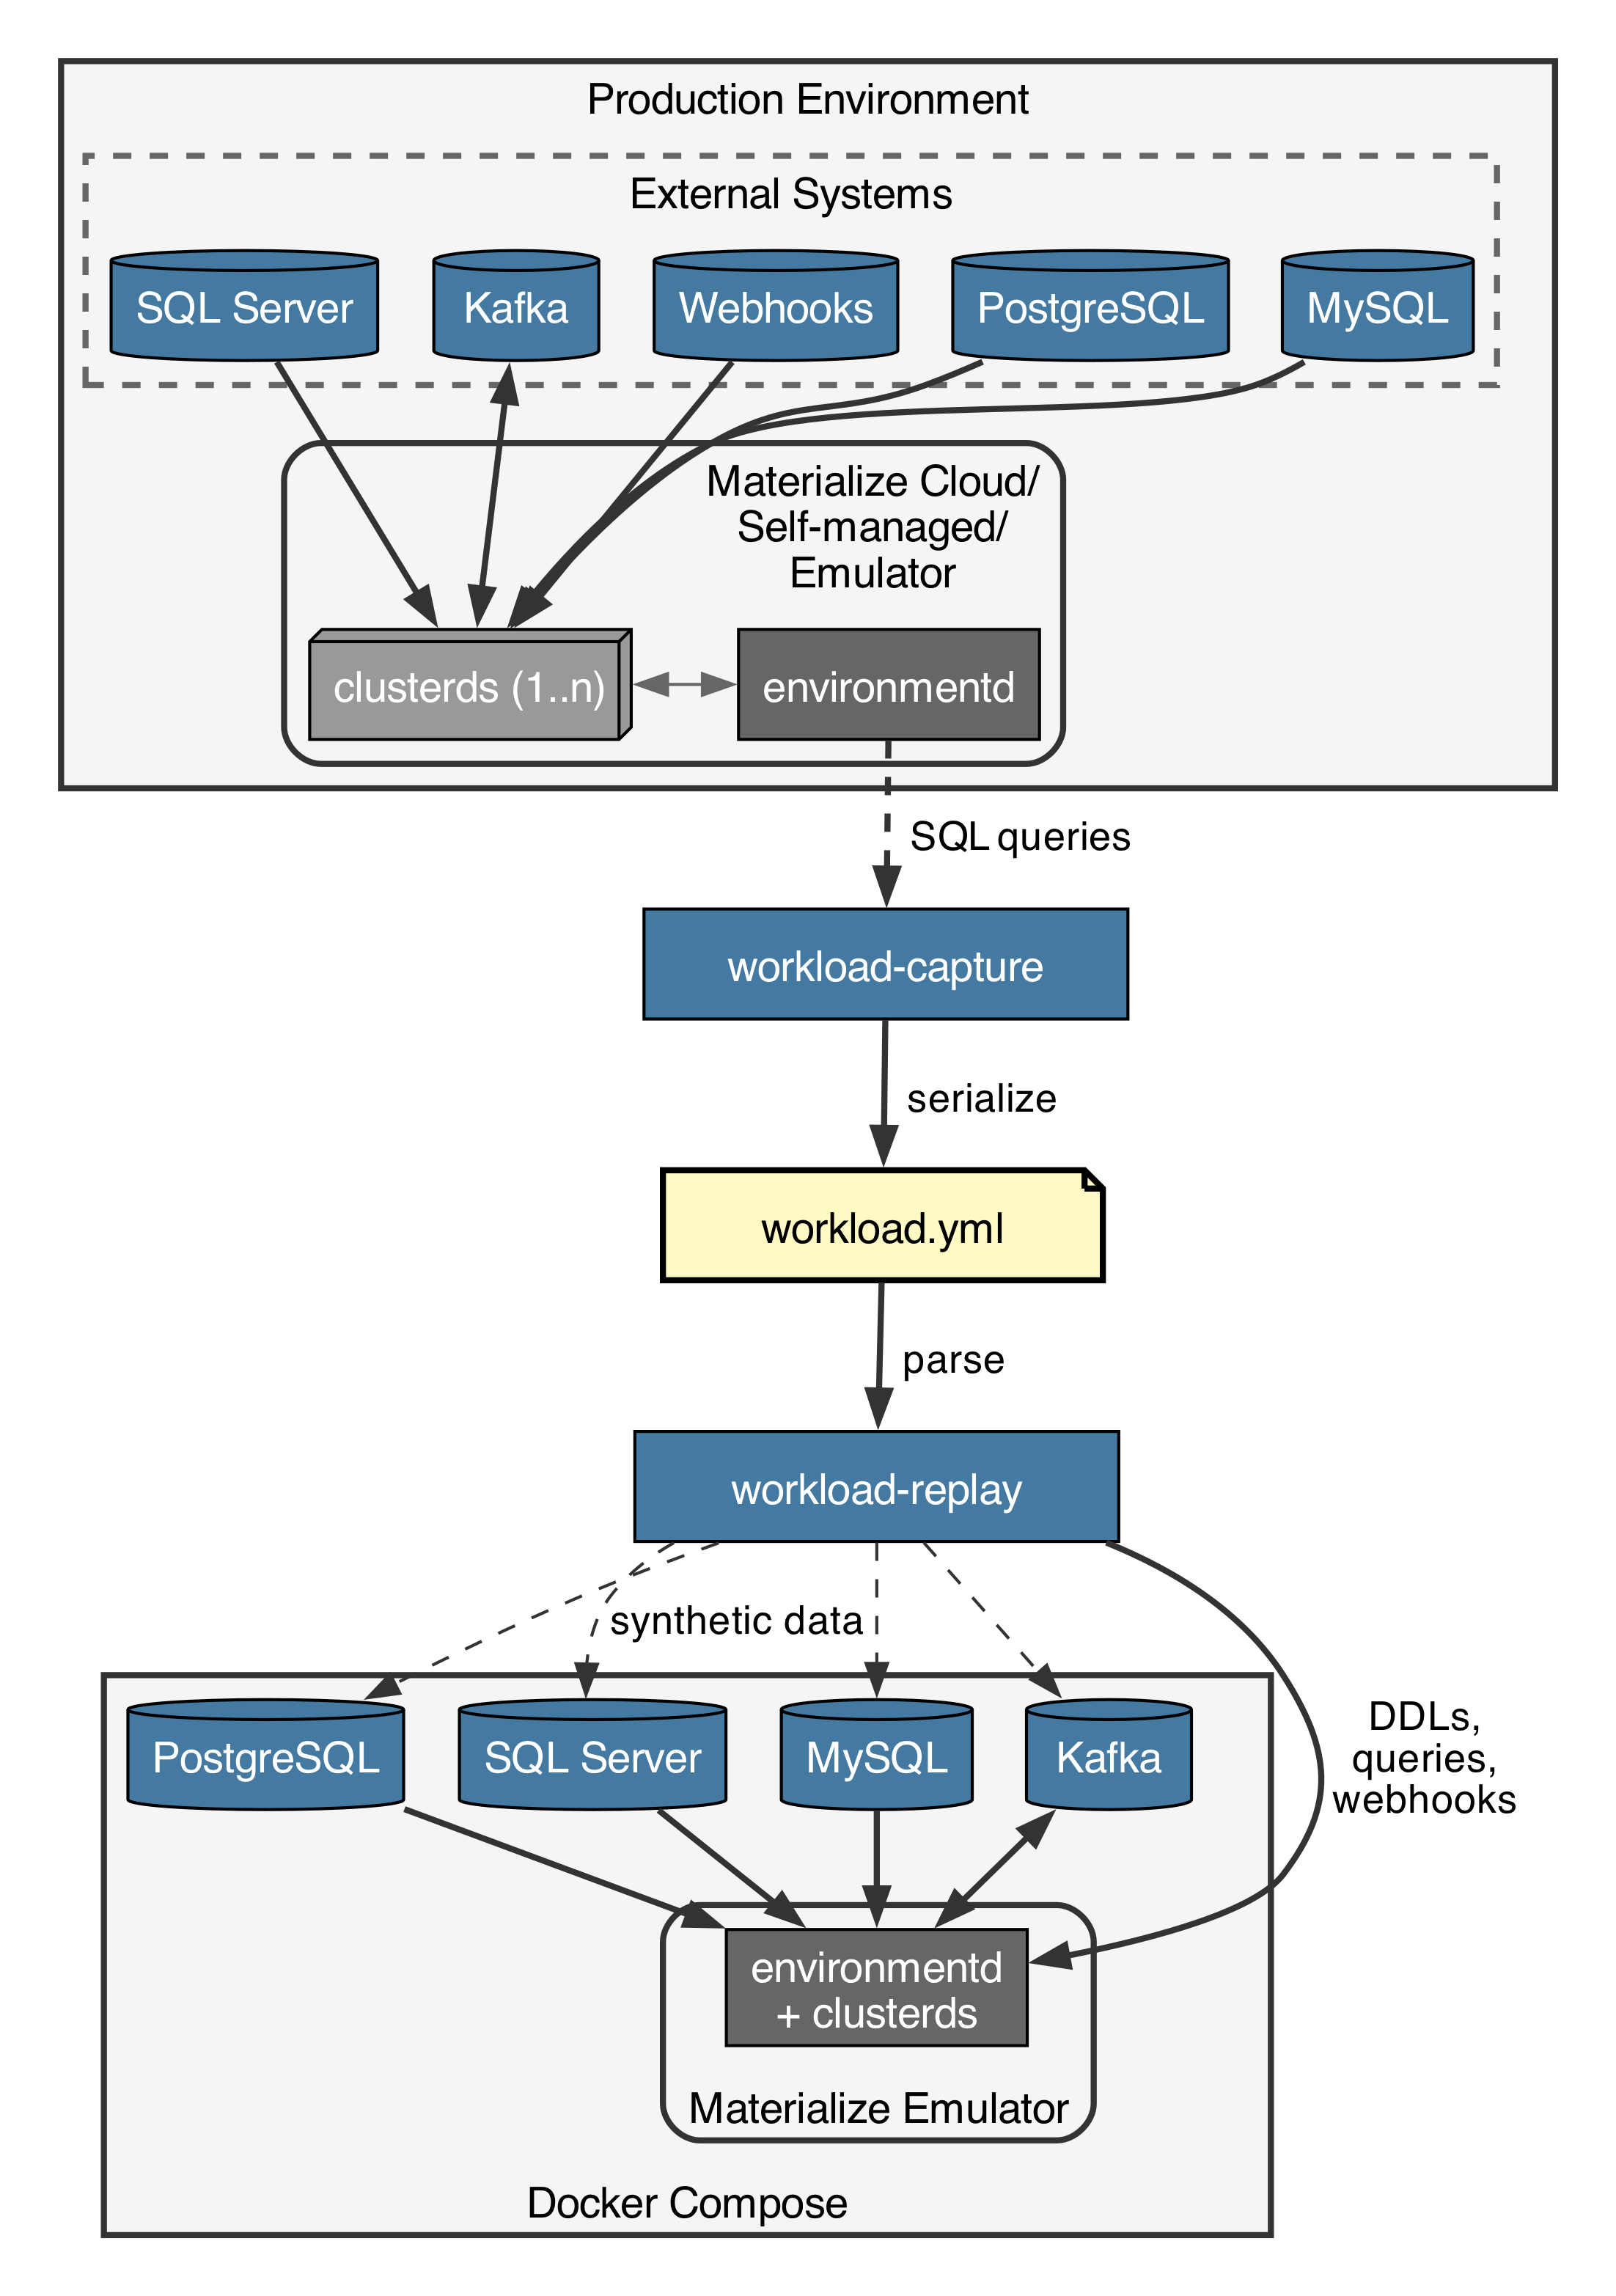
When customers hit issues in production, it can be an effort to locally reproduce them, especially when external sources are involved. Reproducing issues is useful not just to figure out the root cause, but also to verify the fix and add a regression test. The newly introduced workload capture & replay tooling records a Materialize instance's state as well as recent queries and ingestion rates, then replays them in a Docker Compose environment with synthetic data. In this blog post I’ll show how it works and talk about some of the challenges and future work.
Capturing
In this example we are running the Materialize Emulator locally (see related blog post):
1 | |
2 | |
3 | |
4 | |
5 | |
6 | |
7 | |
8 | |
9 | |
10 | |
11 | |
12 | |
13 | |
14 | |
15 | |
16 | |
17 | |
18 | |
19 | |
20 | |
21 | |
22 | |
23 | |
24 | |
25 | |
Capturing a workload is simple. Check out the Materialize repository and run it against the system user’s 6877 port:
1 | |
2 | |
3 | |
4 | |
5 | |
6 | |
7 | |
8 | |
9 | |
10 | |
11 | |
12 | |
13 | |
14 | |
15 | |
16 | |
17 | |
Since our Materialize instance has so few objects, the state is quickly captured. By default the last 360 seconds of queries are captured, but you can also specify --time 3600 for an hour for example. The output is a YAML workload file:
1 | |
2 | |
3 | |
4 | |
5 | |
6 | |
7 | |
8 | |
9 | |
10 | |
11 | |
12 | |
13 | |
14 | |
15 | |
16 | |
17 | |
18 | |
19 | |
20 | |
21 | |
22 | |
23 | |
24 | |
25 | |
26 | |
27 | |
28 | |
29 | |
30 | |
31 | |
32 | |
33 | |
34 | |
35 | |
36 | |
37 | |
38 | |
39 | |
40 | |
41 | |
42 | |
43 | |
44 | |
45 | |
46 | |
47 | |
48 | |
49 | |
50 | |
51 | |
52 | |
53 | |
54 | |
55 | |
56 | |
57 | |
58 | |
59 | |
60 | |
61 | |
62 | |
63 | |
64 | |
65 | |
66 | |
67 | |
68 | |
For the sake of brevity I have removed all but the last query. This was of course a pretty simple setup, but it shows us the most basic functionality of mz-workload-capture. The definitions and metadata of objects are extracted, as well as the queries run during the specified time. For tables we have statistics about how many rows there, but not their actual contents.
The capture tool leverages the introspection views that the Materialize Console is using to show source/sink statistics, as well as the Query History.
What’s been missing in this example are the things actually making Materialize interesting: Ingesting data from large PostgreSQL, MySQL, SQL Server & Kafka sources as well as through Webhooks, and Kafka sinks. But fear not, all of the above are supported by mz-workload-capture as well. This is how a PostgreSQL source looks for example:
1 | |
2 | |
3 | |
4 | |
5 | |
6 | |
7 | |
8 | |
9 | |
10 | |
11 | |
12 | |
13 | |
14 | |
15 | |
16 | |
17 | |
18 | |
19 | |
20 | |
21 | |
22 | |
23 | |
24 | |
25 | |
26 | |
27 | |
28 | |
29 | |
30 | |
31 | |
32 | |
33 | |
34 | |
35 | |
36 | |
37 | |
38 | |
39 | |
40 | |
41 | |
42 | |
As can be seen for sources we have statistics about the total number of messages as well as how many are ingested during a time period.
Replaying
Now we’re getting to the most interesting part: Actually replaying a workload capture file for 1 hour, with 1% of the initial data synthetically generated, and the full amount of queries and ingestions happening during the continuous phase:
1 | |
2 | |
3 | |
Under the hood this sets up a local Docker Compose setup containing all the required services, which always includes the Materialize emulator (materialized), and depending on the sources/sinks in the workload file Kafka, PostgreSQL, MySQL and SQL Server. This means we are currently limited to workloads that can fit on a single machine. Then we create all the specified objects: Clusters, databases, schemas, types, connections, sources, tables, views, materialized views, sinks and indexes.
All connections to external sources are automatically rewritten to target the instances we are running inside of Docker Compose instead of the original systems. The replayer runs in total isolation from the outside world, and sets up everything it needs itself.
As there can be dependencies between objects, the order of creation is important. For views and materialized views there can be dependencies between objects. One solution would be to create a graph and create them in a supported ordering. Instead we chose to retry failed object creations after having created all the other objects, since a failed CREATE DDL is cheap.
After everything is initialized workload-replay generates synthetic data in external sources as specified in each source/subsource/table in Materialize, as well as fills up Materialize-native tables and webhooks. The amount of data can be varied by using --factor-initial-data, defaulting to 1.0, meaning we generate as many rows/messages as are recorded in the original Materialize. Before we can continue we have to wait for Materialize to hydrate all its objects.
Care was taken to make the data generation fast, using COPY FROM STDIN for Postgres/Materialize instead of INSERT, as well as asynchronous data production for Kafka and Webhooks. In our CI we are seeing about 20k rows/s for PostgreSQL sources, 10k rows/s for Kafka, and 3k rows/s for Webhooks. The exact speed depends on the source definition and what views, indexes and materialized views depend on the ingested data, since we start hydrating them during the initial ingestion by default.
The synthetic data itself is generated with a long-tail distribution, which is something that’s often seen in real data.
Finally we have the continuous phase, which in parallel replays data ingestions scaled by --factor-ingestions and queries scaled by --factor-queries. Failing queries and too slow ingestions and queries are logged in the end:
1 | |
2 | |
3 | |
4 | |
5 | |
6 | |
7 | |
8 | |
Regression Tests & Benchmarks
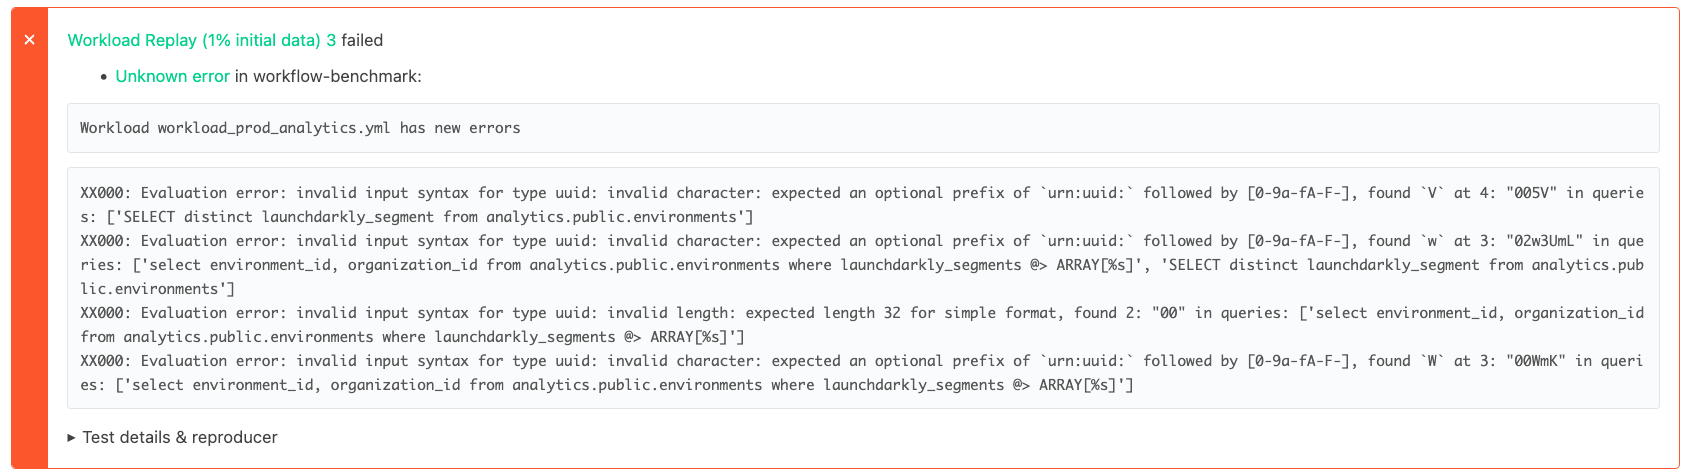
In CI we have a collection of captured workloads and run it against the previous Materialize version compared to the current state. When a query has new errors we can report them as a regression in the new Materialize version and fail the test:
Similarly we can compare the performance between Materialize versions, both for CPU and memory as well as the initial data phase and continuous phase:
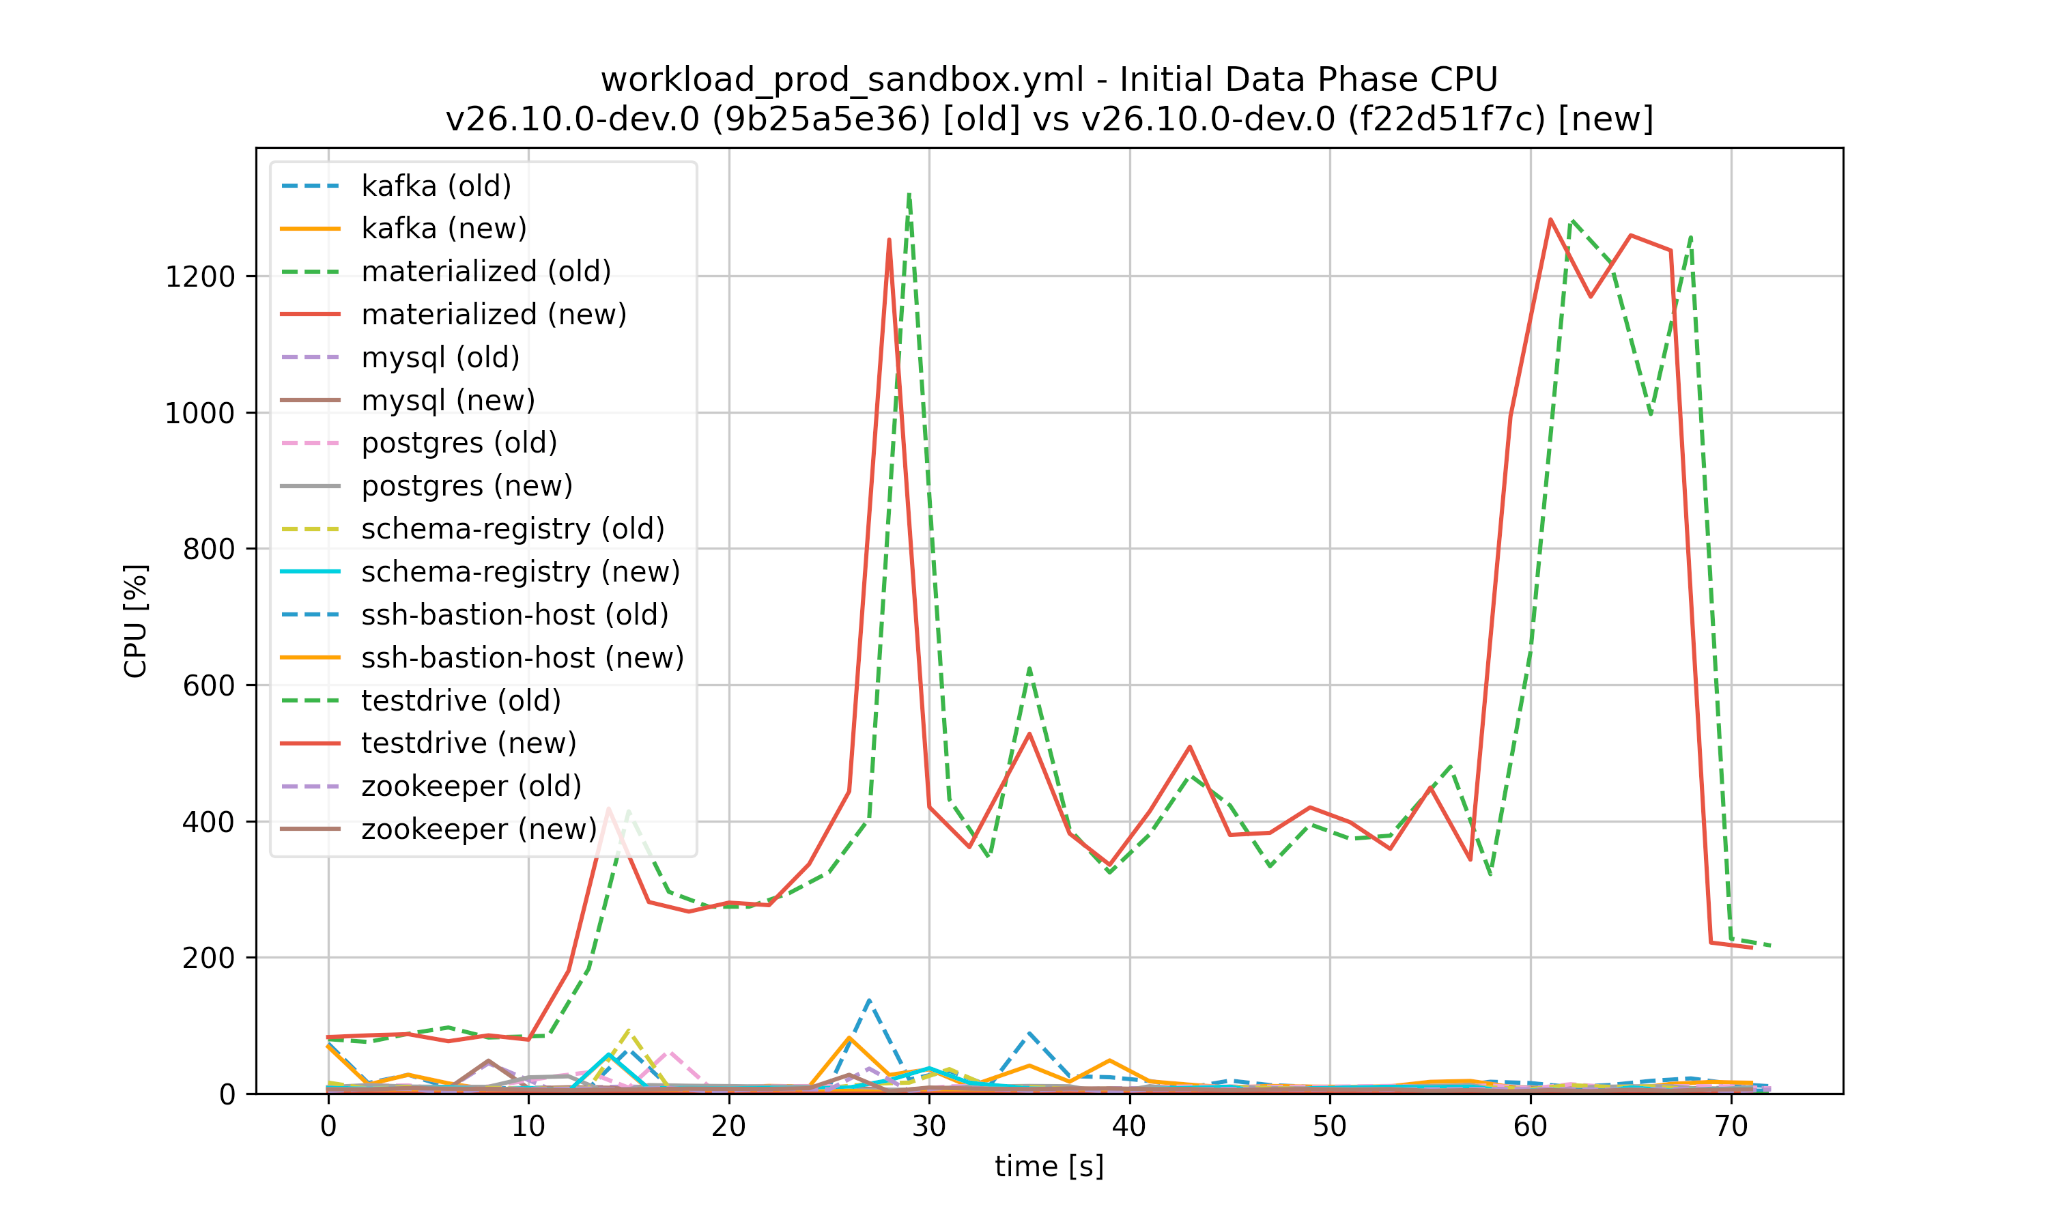
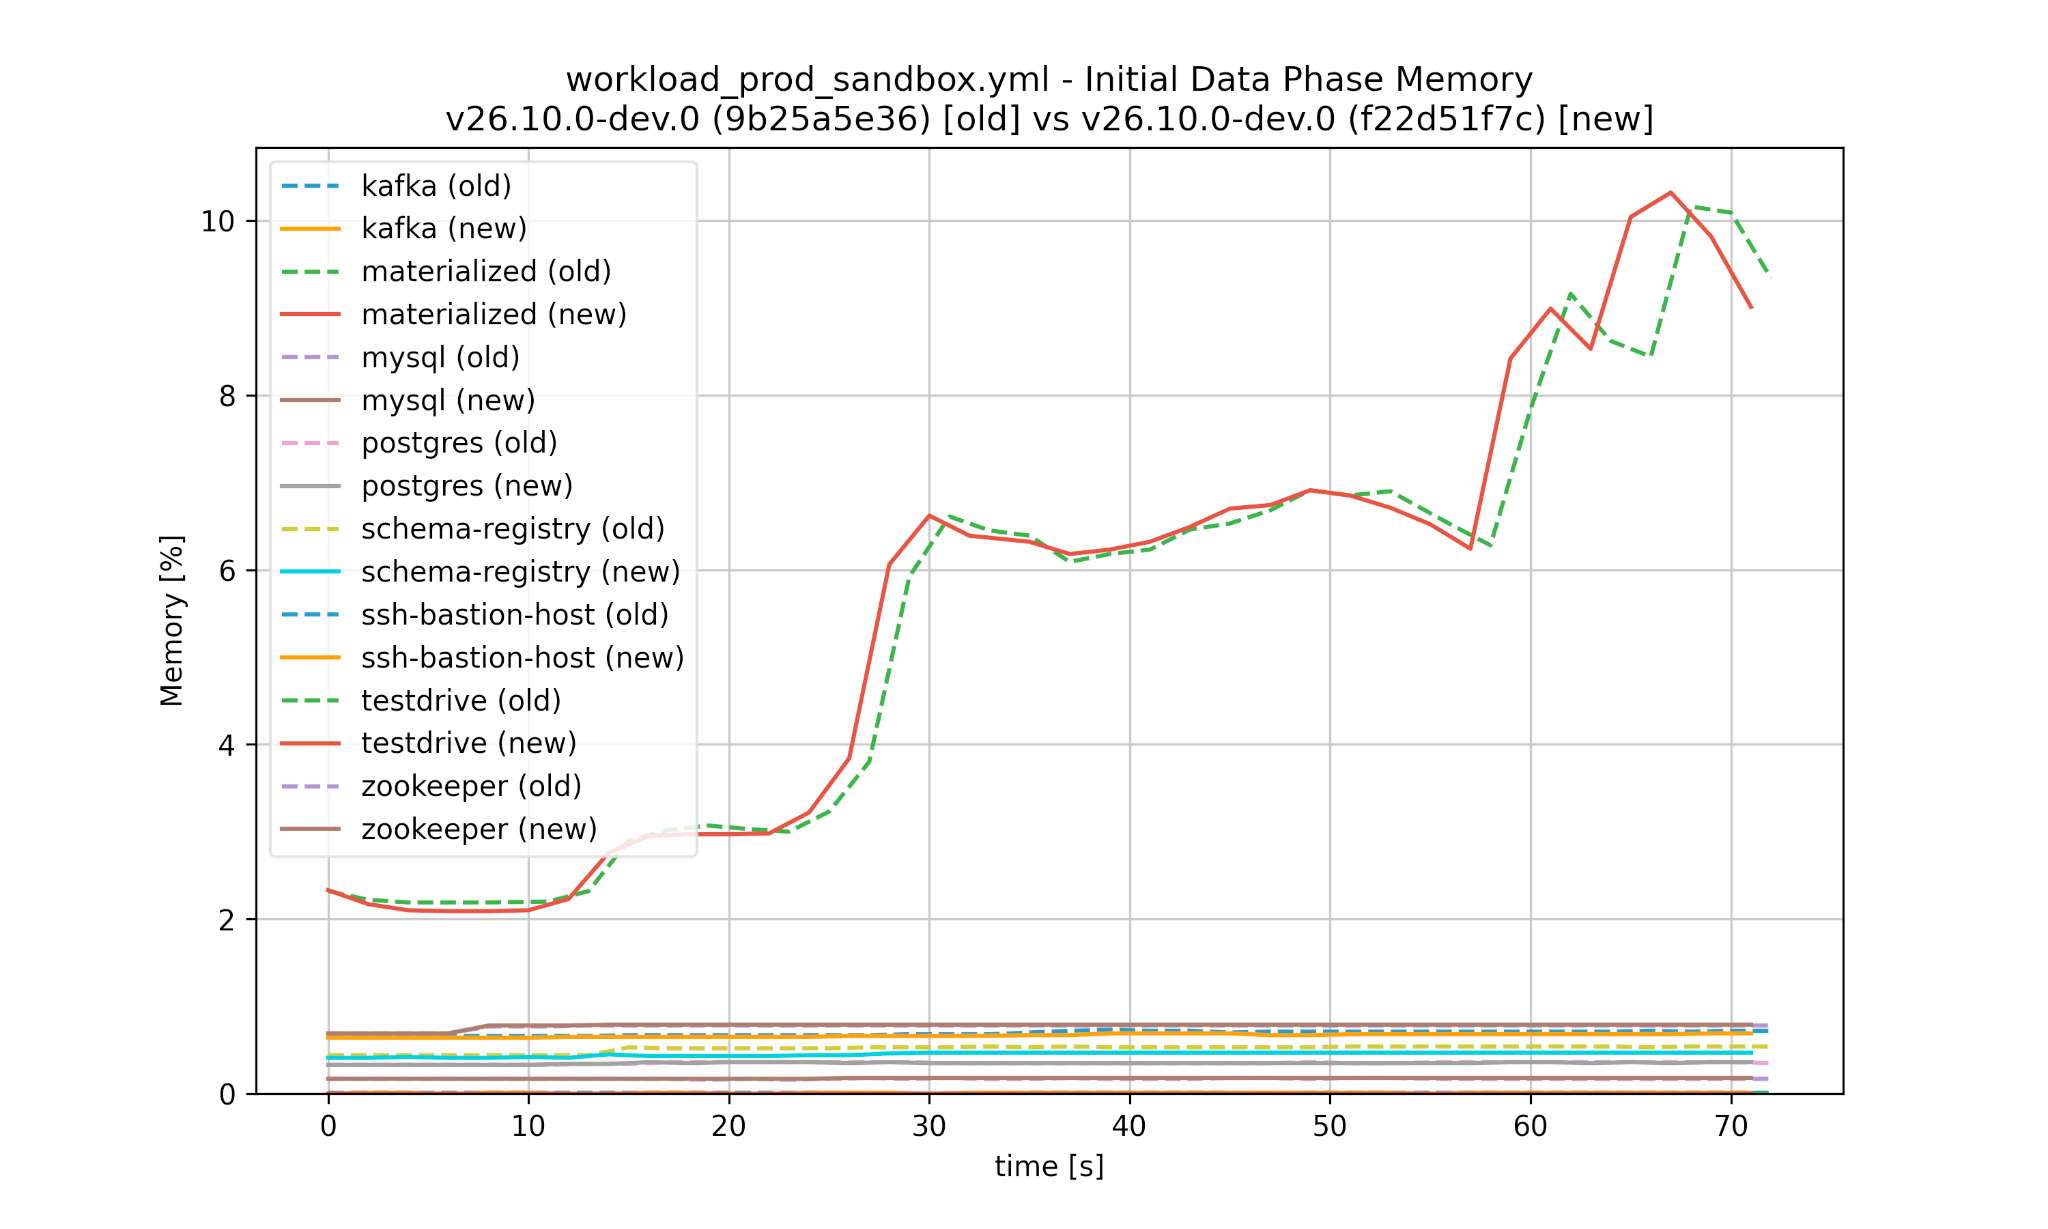
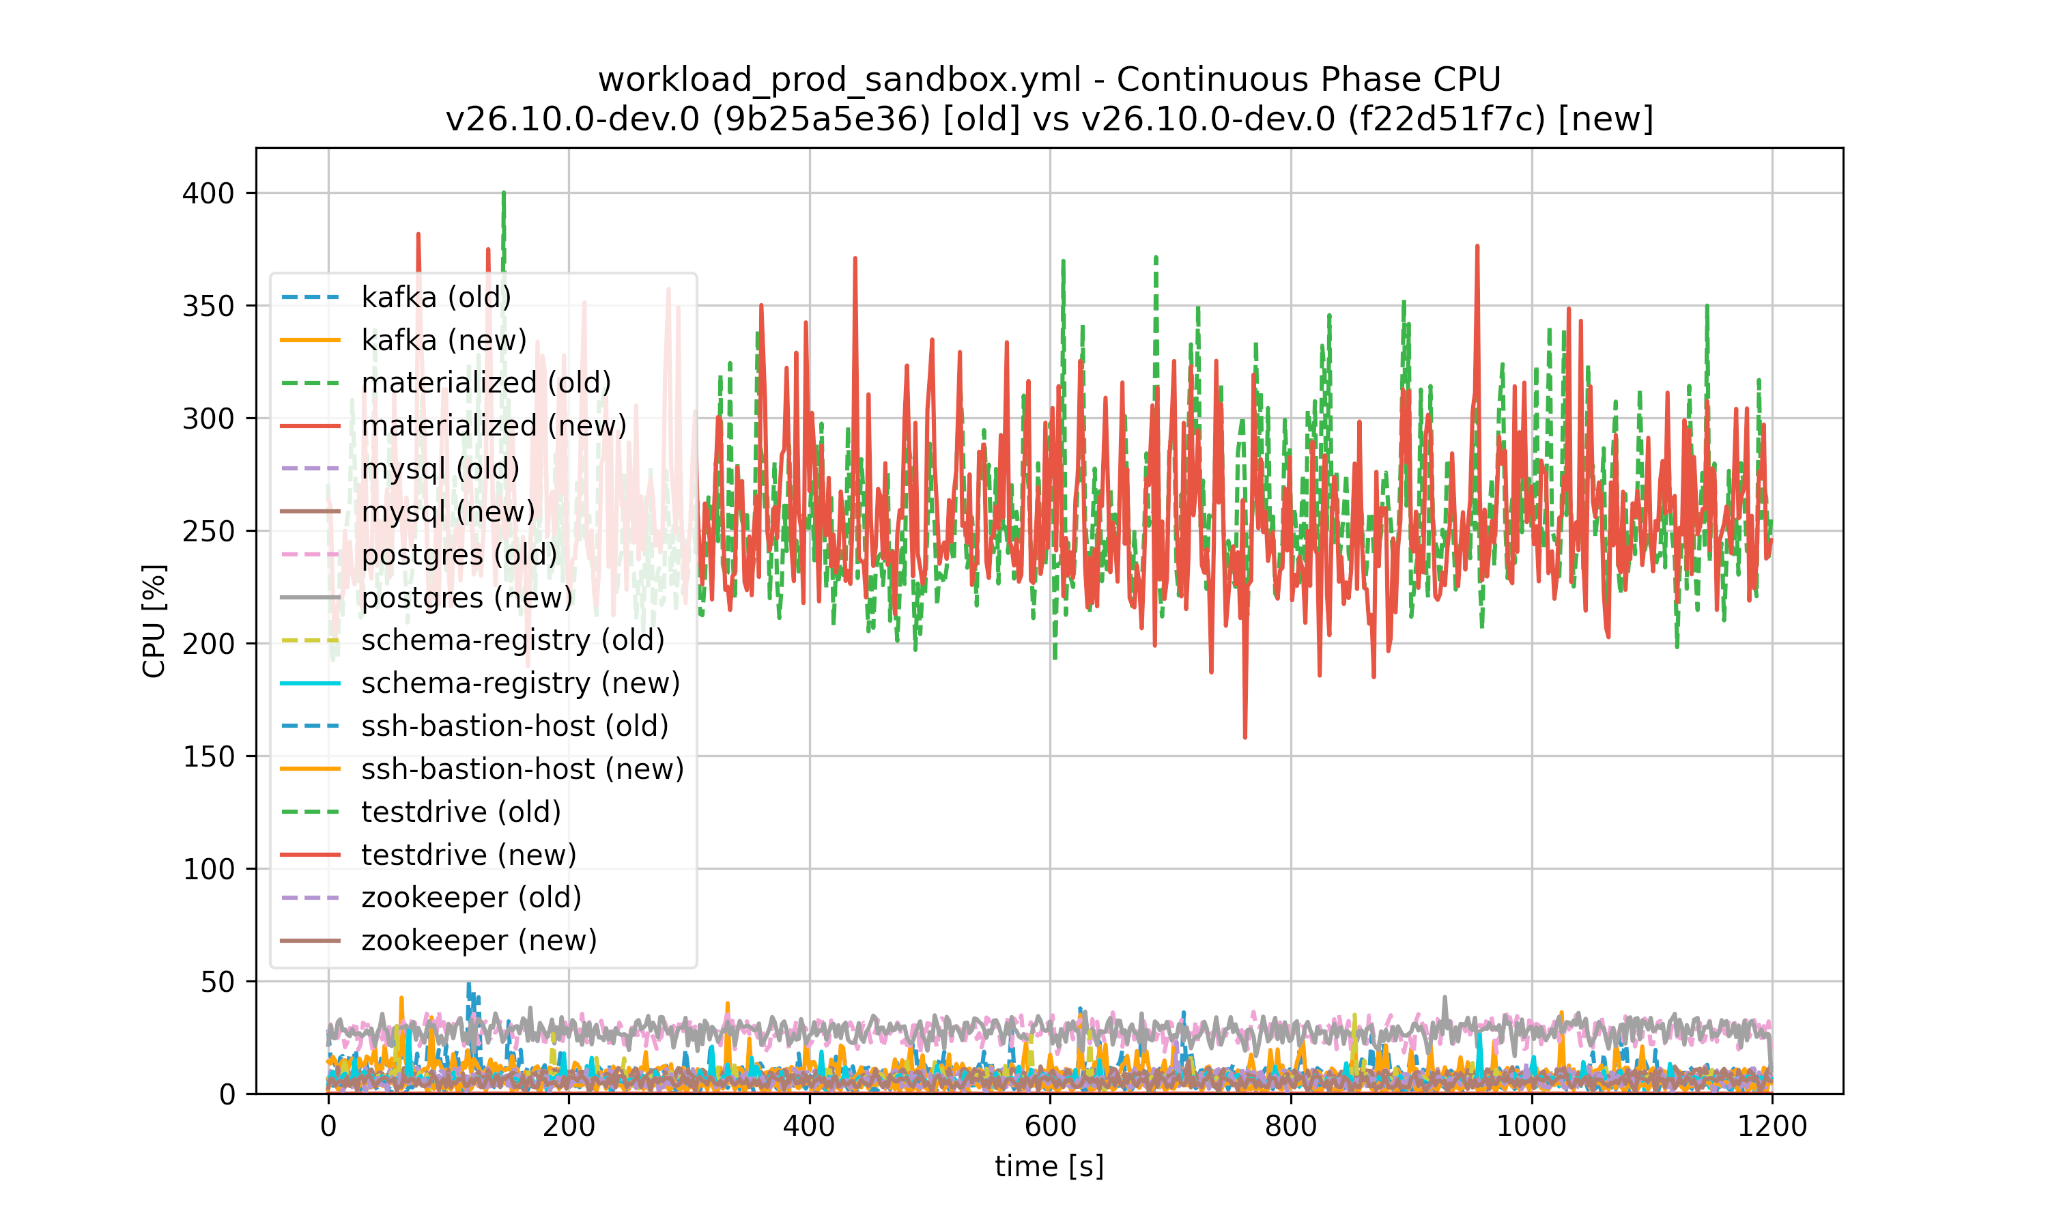
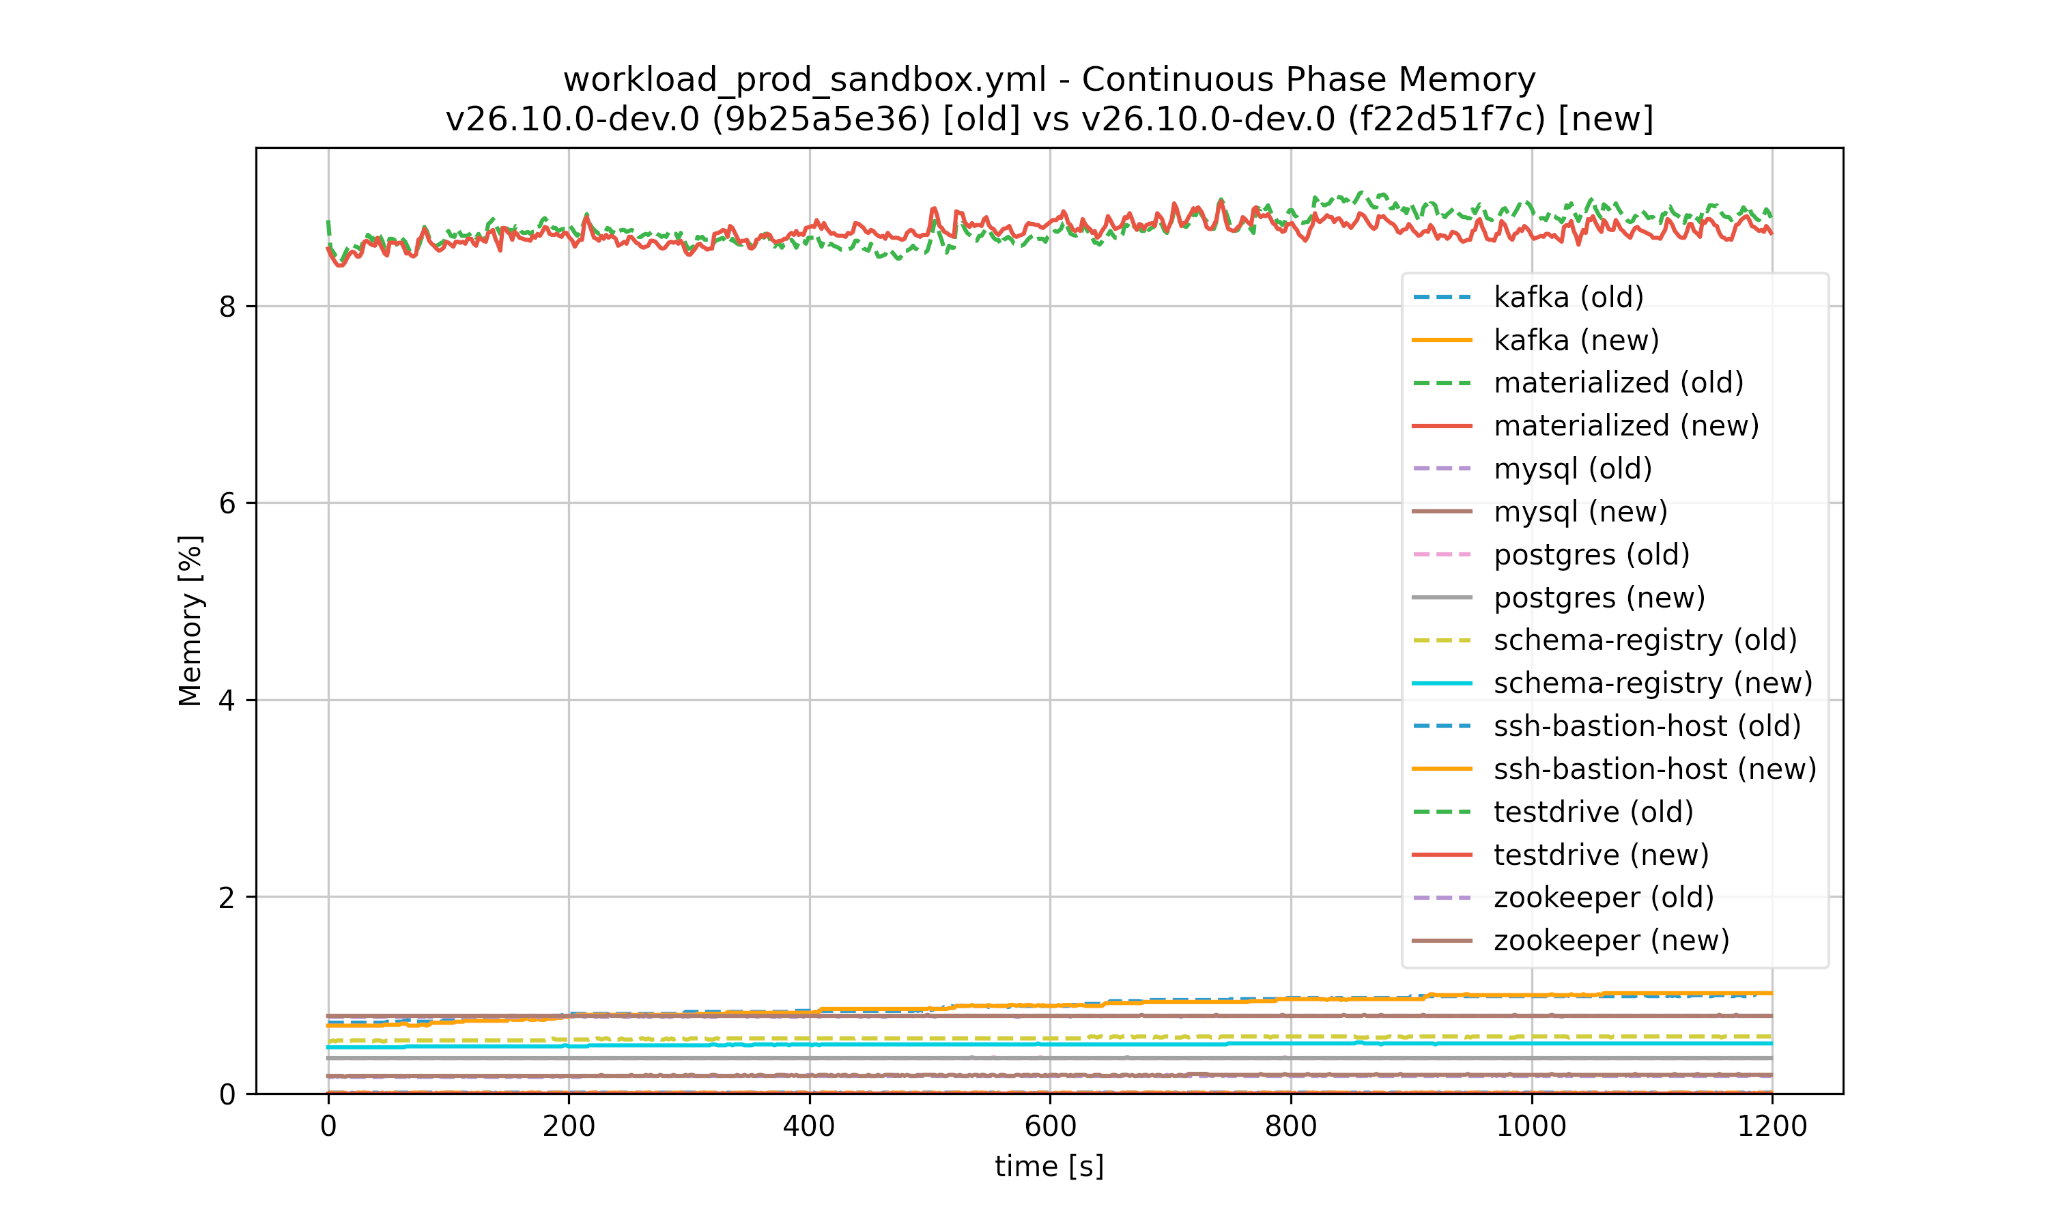
Worse performance is detected automatically and would cause the test in CI to fail:
1 | |
2 | |
3 | |
4 | |
5 | |
6 | |
7 | |
8 | |
9 | |
10 | |
11 | |
12 | |
13 | |
14 | |
15 | |
16 | |
In this example we had a nice optimization causing query times to improve significantly for this workload.
Care is taken to run benchmarks against both Materialize versions with the same seed, and make sure a separate RNG is used for each thread. This ensures that the same random data is generated for data ingestions, and the same queries are executed.
Statistics
Workloads of production systems can be huge, so just looking at them manually can be daunting. We can print some statistics instead:
1 | |
2 | |
3 | |
4 | |
5 | |
6 | |
7 | |
8 | |
9 | |
10 | |
11 | |
12 | |
13 | |
14 | |
15 | |
16 | |
17 | |
18 | |
19 | |
20 | |
21 | |
22 | |
23 | |
24 | |
25 | |
26 | |
Diffing
With a YAML diffing tool like dyff you can get reasonable results for workload files. This allows you to tell the difference between two states of a Materialize instance, making it easier to figure out what changed and caused the different behaviors you might be seeing:
1 | |
2 | |
3 | |
4 | |
5 | |
6 | |
7 | |
8 | |
9 | |
10 | |
11 | |
12 | |
13 | |
14 | |
15 | |
16 | |
17 | |
18 | |
19 | |
20 | |
21 | |
22 | |
23 | |
24 | |
25 | |
26 | |
Anonymizing
When you’re asking someone to hand you a workload yaml file, they can of course inspect whether it contains any information they don’t want to share, be it an identifier, literal in queries, or a default in a table.
We also have an initial simple anonymizer implemented, which currently works on a best-effort basis, as it doesn’t properly parse the SQL queries and reconstruct them (yet):
1 | |
After the modification the workload looks like this:
1 | |
2 | |
3 | |
4 | |
5 | |
6 | |
7 | |
8 | |
9 | |
10 | |
11 | |
12 | |
13 | |
14 | |
15 | |
16 | |
17 | |
18 | |
19 | |
20 | |
21 | |
22 | |
23 | |
24 | |
25 | |
26 | |
27 | |
28 | |
29 | |
30 | |
31 | |
32 | |
33 | |
34 | |
35 | |
36 | |
37 | |
38 | |
39 | |
40 | |
41 | |
42 | |
43 | |
44 | |
45 | |
46 | |
47 | |
48 | |
49 | |
50 | |
51 | |
52 | |
53 | |
54 | |
55 | |
56 | |
57 | |
58 | |
59 | |
60 | |
61 | |
62 | |
63 | |
64 | |
65 | |
66 | |
67 | |
68 | |
As you can see the user-specified identifiers as well as literals have been replaced with non-descriptive ones like table_1, mv_1, literal_1 etc.
Future Work
We have an initial set of workloads that serve as a foundation for internal testing. Expanding the captured workloads would further increase our confidence in Materialize and provide additional assurance to customers by reducing the risk of regressions in their specific use cases.
Today we capture some basic statistics about real data, primarily row counts and total bytes, and we also support collecting average column sizes when needed. Extending the statistics collection would allow us to generate synthetic data whose distributions more closely reflect real-world workloads.
Incorporating real samples, or even full data, would open the door to validating correctness in addition to performance, while also making replayed computations more representative. Achieving this would involve closer integration of the capture tooling into Materialize itself, while the current approach relies only querying Materialize’s introspection views.
We currently don’t support replaying creating a Kafka sink to write out data into a topic, and then reading the same topic back into Materialize through a Kafka source. Instead two separate topics will be used by the workload replay tool.
Replayable workload size is currently bounded by what can be executed on a single machine. Supporting distributed replay against both Materialize Self-managed and Materialize Cloud would significantly broaden the scope of testable workloads, with the main challenge being automated setup of the required external sources.
Finally, evolving the anonymization tool to use a full SQL parser and serializer would make identifier replacement more robust and reliable, since we are currently reliant on some stored CREATE statements instead of generating them dynamically.
Conclusion
Creating test cases manually can be challenging, especially when trying to reproduce problems occurring in large Materialize instances with many external systems involved. The newly introduced Workload Capture & Replay tooling simplifies this significantly and allows us to find regressions earlier in the process. Get in touch with us if you are a customer and interested in supplying a captured workload for testing! The source code of the Workload Capture & Replay tooling is available in our Materialize GitHub repository.