Introducing Query History

Monitoring your query execution is an essential part of building a high-performing, real-time application. After all, what good is capturing all your streaming data if your underlying queries fail to execute effectively, hindering your business’ ability to respond to insights on the freshest data? That’s why we’re excited to introduce Query History - a vital tool designed to help you understand the performance of your queries in Materialize, pinpoint potential bottlenecks, and explore ways to optimize overall performance. Query History is now in Private Preview, and we welcome you to try it out.
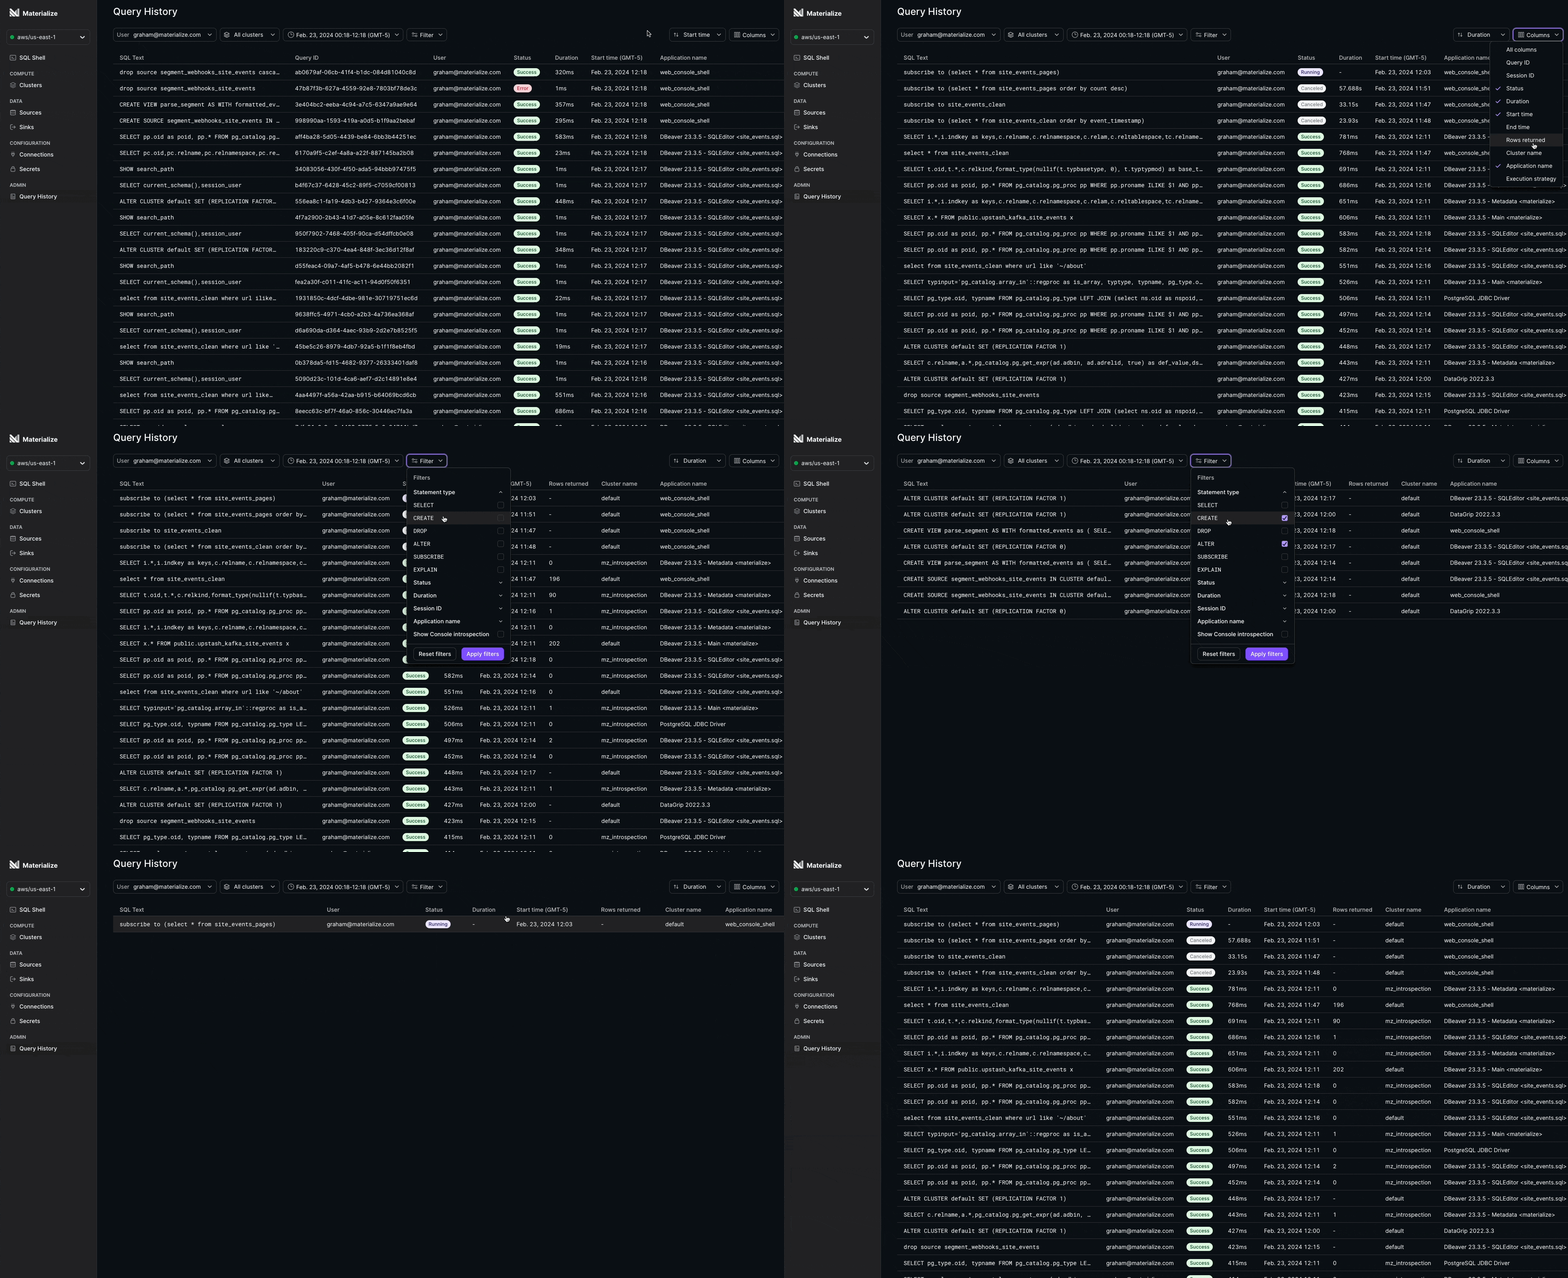
Query History plays a crucial role in helping you optimize query performance. It monitors the performance of your queries over time, and tracks metrics such as execution times, rows returned, query status, etc. You also have a peek into which application or user is issuing the query. Once you’ve identified slow or inefficient queries that may be impacting system performance, you can take corrective actions to improve overall system efficiency.
In addition, understanding query patterns helps you anticipate resource requirements and plans to accommodate current and future demands as you scale your operational workloads and your Materialize deployment.
Getting access
Accessing Query History is easy. Note that since Query History is currently in Private Preview, you must first contact your account team to request the feature be enabled. Once enabled, users with Organization Admin or mz_monitor roles can access Query History from the Admin section in the Materialize console.

Upon accessing the Query History page, you’ll find a comprehensive list of the most recent queries executed in the system. As you hover over the SQL, you will be given visibility into the entire SQL statement. All of the query information is stored in the mz_recent_activity_log view which contains a history of the SQL statements that have been issued to Materialize in the last three days, along with various metadata about them. The information stored in this view, along with its metadata, provide options to further refine the Query History to identify problematic queries more effectively. You can filter queries based on various attributes like user, cluster, execution start/end time, statement type, completion status, and more. You even have the ability to customize your view by adding or removing columns.
Analyzing and optimizing your queries
Query History gives you extensive visibility into your queries to help you troubleshoot the state of your SQL queries by answering questions such as:
- How long is a particular query taking?
- Which users or clusters are issuing the most expensive queries and when?
- Which application session did a slow running query originate from?
- Did the query complete successfully, or did it error out?
Once potential patterns or issues are identified, optimization strategies can be employed. These may include adding indexes, simplifying joins, reducing result set sizes, or implementing other measures to enhance overall performance and stability within your environment.
What’s next for Query History?
We invite you to explore Query History while it’s in Private Preview and we look forward to hearing your feedback. There’s plenty more in store for this feature in the coming months, promising even more detailed visibility into each individual query, along with its full lifecycle. Stay tuned for exciting updates!
