Real-time data quality tests using dbt and Materialize
July 14, 2022

Access to real-time data catalyzes real-time decision making - whether it be in the form of an event driven application, or a product leader making a call based on the current state of a metric. Building using real-time data can mean a greater potential upside and return on investment, but also a greater margin of error when something goes wrong. At the end of the day, a streaming system is only as accurate as the source data it consumes and the transformations we write to produce value from those inputs. Together with the dbt community (shout out to @Josh Wills!) we’ve worked on an adapter that allows you to transform your streaming data in real-time using Materialize as your database. We recently enabled support for continuous testing, and we are thrilled to show off how you can monitor your data pipelines as you would any other production system, and get notified, in real-time, when data quality expectations fail. In practice, what does this mean?
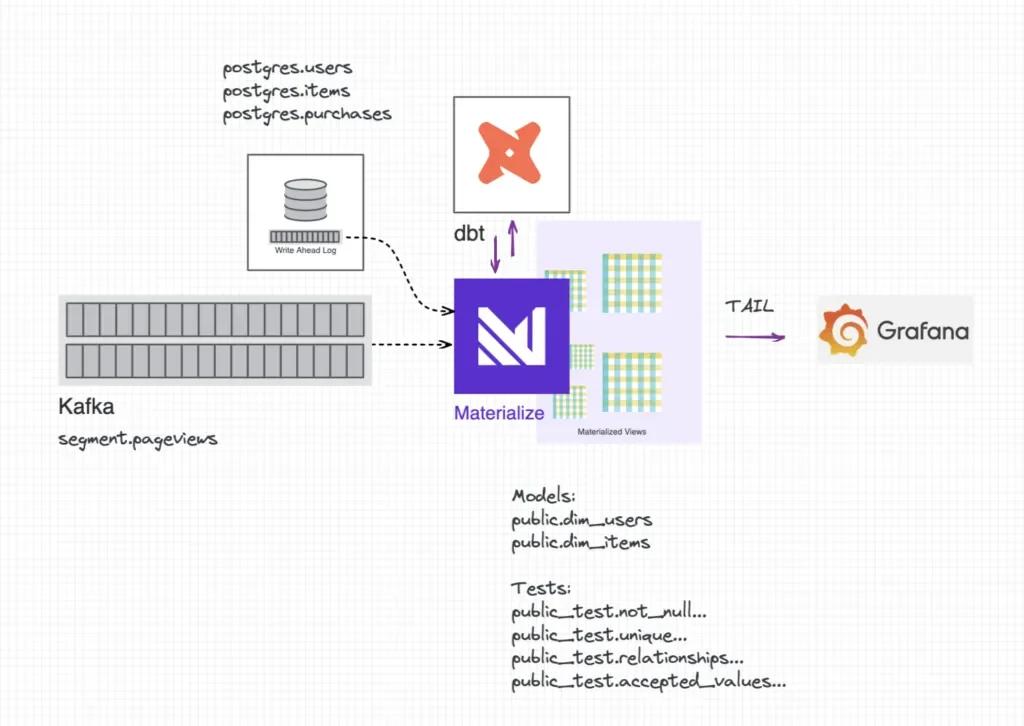
We’ll demonstrate by setting up Materialize to consume data from our business database and a web analytics event stream. We’ll use dbt to define our data model and create continuously updating data quality checks, and we’ll use Grafana (and a mock prometheus exporter) to handle alert routing and delivery. Check out the complete implementation here, and the original ecommerce demo (and inspiration) here.
Under the Hood
As a refresher, a test in dbt is a SQL query that should never return rows. With Materialize, if you opt to store-failures for your tests, a materialized view will be created using each of these queries. We've elected to set this configuration globally for our project, in the dbt_project.yml file.
1 | |
2 | |
3 | |
4 | |
5 | |
6 | |
7 | |
8 | |
9 | |
10 | |
11 | |
We’ve chosen to store test views in a custom schema entitled test. dbt appends this to the target schema, in this case creating a public_test schema for us. dbt natively names each view according to the condition being tested, but these names are also configurable - just supply an alias.
1 | |
2 | |
3 | |
4 | |
5 | |
6 | |
7 | |
8 | |
9 | |
10 | |
None of these test views have rows in them, for now. Our ETL pipeline is working as expected.
important
💡 Note: We added one additional materialized view, etl_alert, which UNIONs all of the alert views together and counts the number of failing records for each.
Exercise 1: Upstream Data Changes
Materialize is set up to ingest changes from the upstream billing database via a direct postgres source. Let’s say the billing team is adding a new item to our purchasable set. We can emulate this behavior by inserting a row into the billing database items table, and we can watch as that change cascades through our data model.
1 | |
2 | |
3 | |
4 | |
5 | |
6 | |
7 | |
8 | |
9 | |
10 | |
11 | |
12 | |
13 | |
14 | |
15 | |
16 | |
17 | |
18 | |
19 | |
20 | |
Selecting from these test views reveals that two data quality checks have failed. One on our staging table, to tell us that a new item has been introduced without a price. The other on our downstream dimension table, letting us know that we’ll need to adequately handle the new item in our analytics/reporting views.
Alerts
The queries above return the current state of our ETL pipeline and can be visualized using a compatible BI tool. But how can we understand exactly when a data quality check failed?
Materialize exposes a TAIL command that can be used to grab at how a relation changed over time. The output is a sequence of timestamped updates that can be viewed via an interactive SQL session or consumed by an application downstream.
When the new item was inserted into the product database, we received two updates to let us know that two of our pipeline tests had failed:
1 | |
2 | |
3 | |
4 | |
5 | |
6 | |
7 | |
8 | |
Armed with this information, we can quickly reach out to product and engineering to understand how and why our upstream database changed. What happened yesterday, or last week, becomes, what just happened?
Alert Resolution
Once the item price has been set, we’ll receive an additional update from our subscription to let us know that our staging data test is no longer failing:
1 | |
2 | |
3 | |
4 | |
5 | |
6 | |
7 | |
With the correct price, we can update our downstream model to handle it correctly, update our test condition, and resolve the outstanding alert.
1 | |
2 | |
3 | |
4 | |
5 | |
Exercise 2: Streaming Joins
Materialize excels when asked to join data from multiple sources together. Our dim_users table is an aggregation of the current state of each user, and includes both web analytics and product information. Unfortunately, a new alert is firing, in this case, called unique_dim_users_id. Let’s conduct a root cause analysis together to see what got mucked up.
Peep the alert table and grab an offensive record from our dim_users table:
1 | |
2 | |
3 | |
4 | |
5 | |
6 | |
7 | |
8 | |
9 | |
10 | |
11 | |
12 | |
13 | |
14 | |
Oh no! These duplicate rows will cause downstream revenue aggregations to be double counted. Queue the alarm bells… and emails, and slack messages, and pre-board meeting late nights. But also literally and immediately queue the incorrect event actions we send to other (reactive) systems.
Oops. Luckily, triage is almost done. A little more sleuthing reveals that recent segment events have empty email address fields, causing the join we initially wrote to become incorrect. We’ll quickly update our data model to account for this change and file tickets with the correct team to investigate.
Notifications
💡 Materialize is wire-compatible with PostgreSQL, which means it integrates with most client libraries, ORM frameworks and other third-party tools that support PostgreSQL. Check out our connection-examples repository for a quick-start guide to implementing the above TAIL command using your favorite programming language.
We’ve included a (bare bones) Python script to demonstrate how to create metrics from the alert view subscription and expose them on an endpoint prometheus knows to scrape. We chose to go this route to take advantage of observability best practices.
Using Grafana, we can create alert rules and notification policies that route alerts to Slack or PagerDuty (among other destinations). We can silence alerts while we diagnose and correct data quality issues as they arise, and we can even link out to playbooks built to help data/BI engineers and analysts triage the data pipeline.
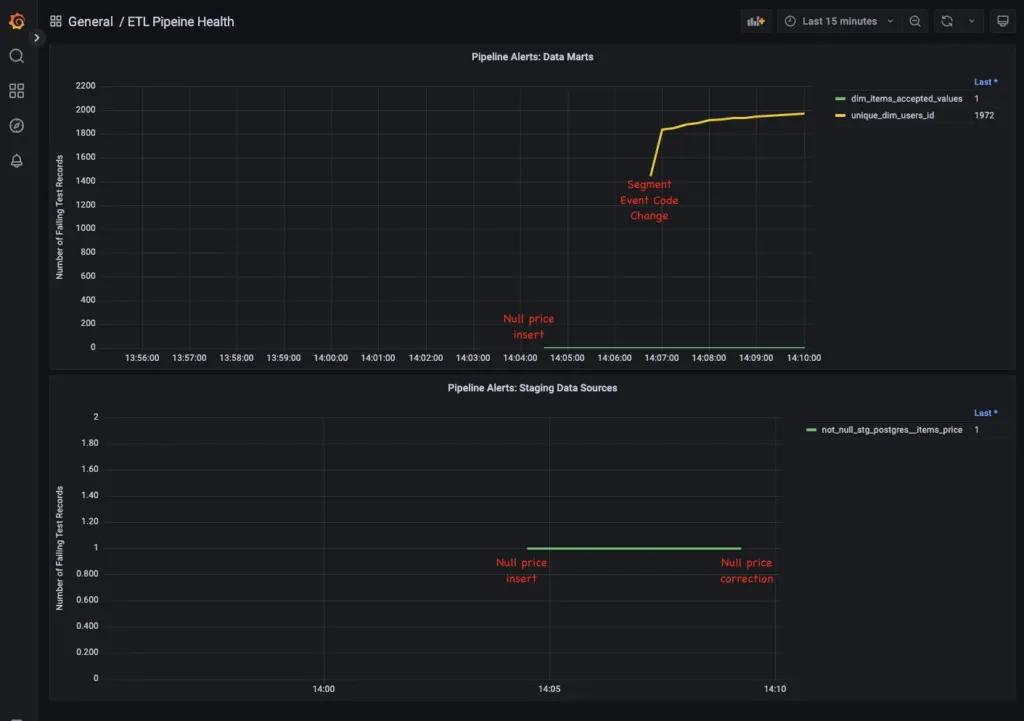
We’ve created two different graphs and corresponding alert rules using the Grafana UI, both set to yell if our etl_alert_rows value is greater than 0. Staging table alerts are routed to the data engineering team, since they sit directly on top of the sources that Materialize consumes. Data mart alerts are routed to the analyst or BI engineering team, since they manage the transformation layer.
This is just one of many options for getting data out of Materialize in the form of notifications. Alternatively, you can sink the alert stream back out to kafka, or use a compatible BI or reverse ETL tool to query the alert view and ship the data around from there.
Ok, so what?
Using Materialize as your backend, there is no need for an orchestrator to schedule data model runs. The 'how is our system updated' piece of the data observability equation has been taken care of for us.
Streaming data quality checks enables the second piece - we can more clearly see what is happening within the pipelines we've created, and ensure our systems are working as expected to surface the data we’ll take action on downstream.
Join Us!
If you'd like to walk through this demo in a meetup, check out Materialize + dbt: From Streaming Analytics to Continuous Testing!
If you are working through your own dbt set up using Materialize, we’d love to talk to you about it! Please drop by our community slack - #dbt-materialize.
If you’re interested in diving even deeper, sign up for Materialize Early Access or set up a demo with our team.