Speeding up Materialize CI

In the previous post I talked about how we test Materialize. This time I’ll describe how I significantly sped up our Continuous Integration (CI) Test pipeline in July, especially for pull requests that require a build and full test run. The goal is to make developers more productive by reducing the time waiting for CI to complete.
We always kept CI runtime in mind, but it still slowly crept up over the years through adding tests, the code itself growing larger, as well as hundreds of minor cuts adding up.
This graph shows the CI runtimes for PRs requiring a build and tests. It is still missing my latest changes, since some of them are not merged, and not every PR has been rebased:
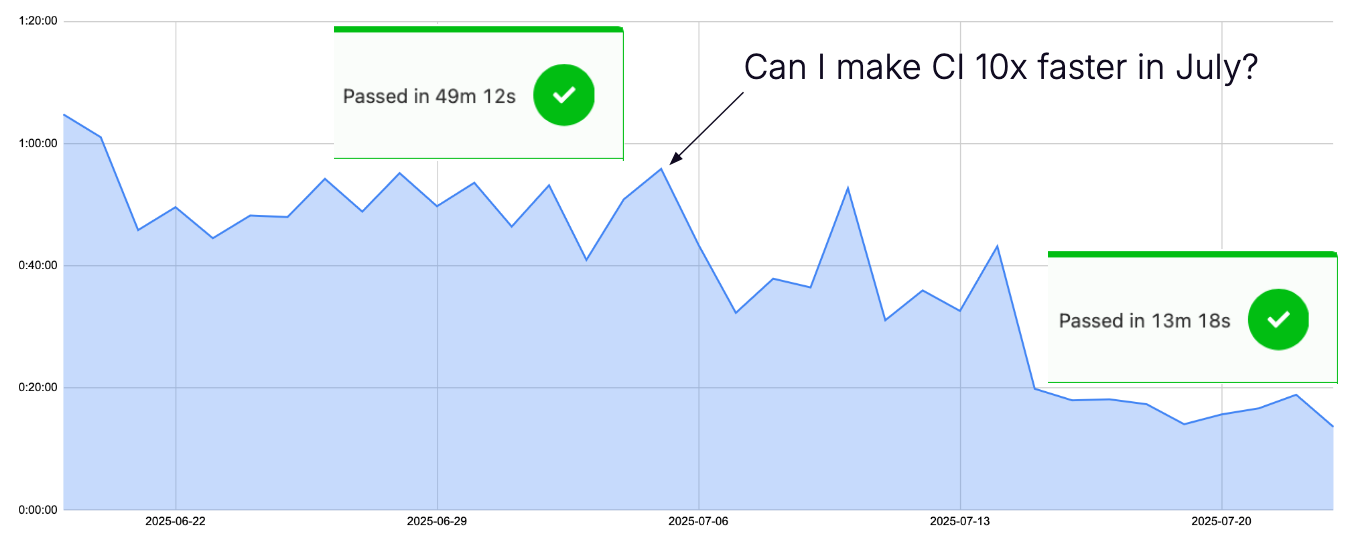
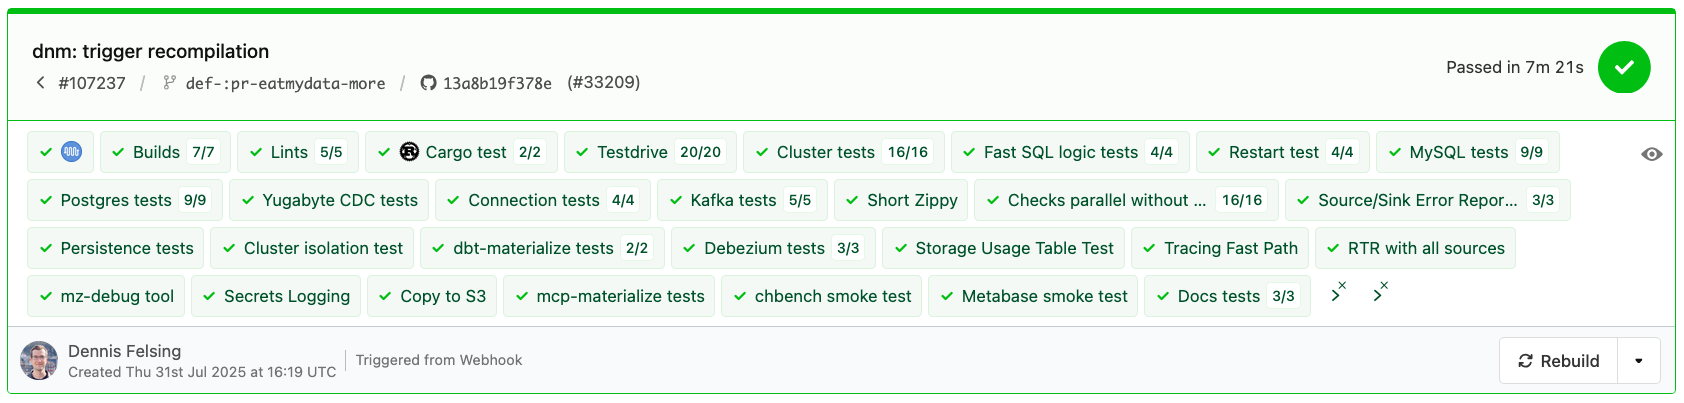
The latest state from July 31 is a test run with a minimal recompilation, finishing in 7 minutes, about 7x as fast as this same run would have been on July 1:
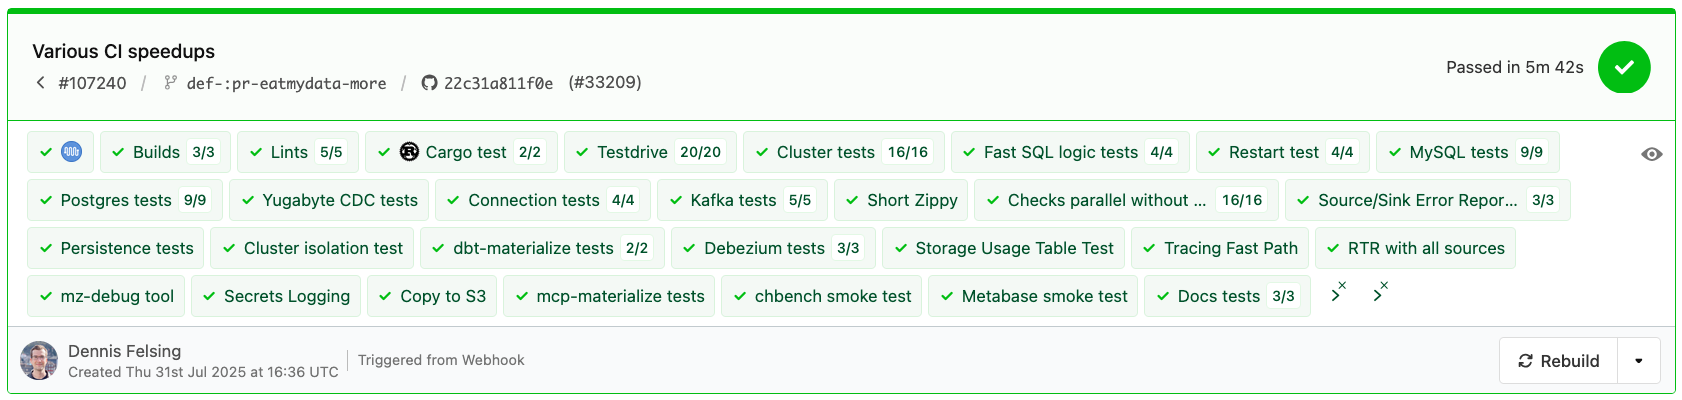
The same PR finishes in less than 6 minutes without the build:
In practice build time can vary between 1-9 minutes, so we should now be able to finish a full CI run in 15 minutes at worst. We do have slower tests but those are tucked away in our Nightly (mostly ⟨ 2 hours) and Release Qualification (1 day) pipelines. I’ll go through some of the reasons our CI was slow, and what I did to speed it up.
Pipeline creation
There used to be two mkpipeline scripts, the first to check if we need to bootstrap our ci-builder Docker images, the second to generate the Buildkite pipeline from our template, based on whether a build is required, which tests are relevant to the change, etc. Since bootstrapping was usually unnecessary I added logic to fuse the scripts together into one when possible, which saves some time from not having to schedule the job on an agent.
API calls and external program calls were taking most of the time, and could easily be parallelized. Using the Docker Hub API to check if an image is already available is about 5 times faster than running docker manifest inspect. Caching a list of all known available images locally is even faster of course.
To make sure we have good local caches we now keep an agent around for mkpipeline.
Builds
Materialize is written in Rust, and compilation is generally slow. Our baseline was using Bazel with its remote caching, which is able to build Materialize in 23 minutes in CI.
For regular test runs we now disable LTO since it adds about 20 minutes to incremental build times, while only making Materialize about 10% faster at runtime. For our actual releases we still use LTO.
Unfortunately Bazel doesn’t work well with Cargo’s incremental compilation, so we switched these specific builds back to cargo as well as to a larger agent. We currently use this Cargo build profile:
1 | |
2 | |
3 | |
4 | |
5 | |
Similarly to mkpipeline, keeping an agent with warm caches around helps significantly here.
Most of our CI is using Docker images. Building these Docker images and pushing them to Docker Hub also used to take 5 minutes, by parallelizing and fusing the build and push steps together in a single docker buildx build --push we are now taking about 2 minutes in the worst case of having to push all images.
Since we know what CPUs our CI runs on, we can optimize the binaries further, for example with -Ctarget-cpu=x86-64-v3 -Ctarget-feature=+aes,+pclmulqdq , which allows the Rust compiler to target Intel Haswell, AMD Ryzen or newer CPUs. This helps to counteract the lost performance from disabling LTO.
We already had logic to calculate a hash of all files relevant for a build, so that we don’t have to rebuild on each test run, even if some test-only files have changed.
An option for the future is to not use Docker Hub, but upload the executables to an object store we control ourselves. Only about half of the Docker image size is the actual executable, the rest changes at most once a week when we upgrade our image dependencies. Since our testing design mostly depends on Docker images, we’d have to finish building them locally on the test runner with the executable though, which adds some more overhead. It is not clear if we’d save time doing that.
Lints & cargo test
As with all the other steps so far, keeping dedicated agents around is important so that Cargo caches stay warm in subsequent runs!
One issue here was that cargo exclusively relies on file modification times to determine if a file has changed and needs to be recompiled. This required care since we had a script to clean up the git repository and restore ownership of files, which might have been changed by Docker containers running as root or another user internally. Changing ownership counts as modifying the file, so we had to tone that down to only clean up files that our tests actually write to as another user.
As for cargo test we were already using nextest to speed up our unit tests, I made sure to also use the optimized Cargo build profile instead of the default dev builds without any optimizations. Some individual tests were iterating over dozens of files, so I split them up further so that they can be parallelized better. Most of the tests don’t benefit from the regular builds, since we are not building and uploading the test executables to Docker Hub. An exception are our Cargo tests making use of the clusterd executable. These tests now download the clusterd image when it’s available instead of building it themselves.
I parallelized the Cargo test runs on two agents. Instead of using nextest's own "--partition=count:{partition}/{total} we switched to determining which package to run via --package=... on which of the agents, which also saves some compile time.
SQL Logic Tests
We have a huge number of SLT files to run through. The main realization here was that our sqllogictest executable mostly runs single-threaded, so we can parallelize it on each CI agent by sharding across all files and run one sqllogictest executable per available CPU core. This required making the prefix for our metadata store configurable so that multiple SLT executables could share a single metadata store.
Other Tests
Every test was slow for its own reason, execution time for most tests was hovering at 15-25 minutes, now all are able to execute in under 5 minutes. Some highlights:
- Switch from stable to minimal ci-builder: 4 min → 1 min download time. Most tests don’t need the ability to build code.
- Reduce Materialize container startup time, initialize PostgreSQL ahead of time: 40 s → 5.6 s. The surprise here was that we were previously initializing PostgreSQL, but then crashing it, which caused a recovery during the regular container startup.
- Keep persistent testdrive containers around instead of creating new ones for each invocation: -3 s per call. This adds up since some tests execute
testdrivehundreds or thousands of times. - Retry faster in testdrive, no more exponential backoff
- Parallelize tests more, shard more fairly
- Start up all containers in parallel when possible
- Reduce testdrive timeout from 6 min to 20 s → Faster results when a test fails
- Local socket connections instead of through port, this is especially impactful for our connections to PostgreSQL as our metadata store. Specifying the socket can be awkward when using a URI though:
postgres://root@%2Fvar%2Frun%2Fpostgresql/ - During cleanup:
docker compose down --timeout=0, reducing the timeout to 0 means that we kill the containers immediately. Since this happens after our test execution is finished, we don’t care about graceful shutdowns anymore. - For
git cloneI aim to use shallow clones, but currently we still have some tools in tests that require git history. We do have a large submodule that is currently downloaded in every test, but only actually required in one.
Hetzner Agent Provisioning
Most of our CI runs on Hetzner with a custom-built autoscaler. It now detects which locations have which machines available to prevent us from uselessly wasting API quota trying to provision agents that won’t come up anyway. After 20 minutes of failing to provision agents we fall back to AWS.
A major step in speeding up the tests was to already provision agents for the tests while the build is still running. The agents can start preparing, downloading the available images. This reduces our preparation time from 4 minutes down to 1 minute on average.
Installing Docker itself on the agents took more than a minute through Fedora’s package manager. Meanwhile downloading the executables directly finishes in a few seconds.
Eat my Data
We are now using libeatmydata across CI and tests. Many actions are filesystem intensive, and we don’t care at all what happens to the data when the agent crashes, since we will never schedule anything on it again. This especially affects our use of PostgreSQL as our metadata store, as well as persisting objects in the blob store.
An easy way to check if a program is correctly using libeatmydata is to grep for the library in /proc/.../maps. For Go applications libeatmydata won’t work because they don’t dynamically link to the C standard library by default. An alternative is running on a tmpfs in memory, or modifying the application code manually to not execute fsync and related syscalls in testing.
You can easily try out the effect when running DDL queries against Materialize:
1 | |
2 | |
3 | |
4 | |
5 | |
The effect --env MZ_EAT_MY_DATA=1 has on my system is stark:
1 | |
2 | |
3 | |
4 | |
Docker host networking
I expected a large impact from switching from Docker’s bridge networking to host networking, but it didn’t seem to be worth it for most tests. It seems like most of our tests are not network-bound at the moment. Using host networking also causes a bunch of confusion in tests that have many containers running at once, with a risk for port conflicts causing hard-to-debug CI failures. So I have opted not to submit the change, after all keeping CI sane and stable comes first.
Takeaways
Materialize has many features and interacts with many systems:
- Applications interact with Materialize using the Postgres protocol
- Users additionally run queries using HTTP, WebSockets, and through the MCP server*
- Materialize itself is a distributed system with multiple clusters on separate nodes
- Two
environmentdprocesses can run at once during a zero-downtime upgrade* - Materialize communicates with PostgreSQL* or CockroachDB and S3 or Azure Blob Storage* services for its internal catalog and storage needs
- Data is continuously ingested from a Kafka broker (plus a schema registry), Postgres, MySQL, SQL Server*, Webhooks and Fivetran*
- Data is continuously written to a Kafka broker and exported to S3
The stars (*) mark the newly supported systems since my previous post about a year ago. This shows why we have to keep growing our testing efforts and at the same time keep CI runtime low. Since there are so many separate systems at play, using Docker Compose to orchestrate them in testing is a huge benefit. The main takeaways for me are:
- Keep agents up and their caches warm for easily cacheable tasks, make sure no tool messes with modification times
- Cargo incremental compilation and disabled LTO are key for fast Rust builds
eatmydataortmpfsfor tests involving a lot of safe filesystem interaction (databases, object storage)- Start work as early as possible, for us this involved scheduling agents while the build is still running, allowing them to
git cloneanddocker pullas far as possible - Follow the cycle of Measure → Optimize/parallelize → Measure until fast enough
- Set up monitoring for CI runtimes to catch regressions in the future