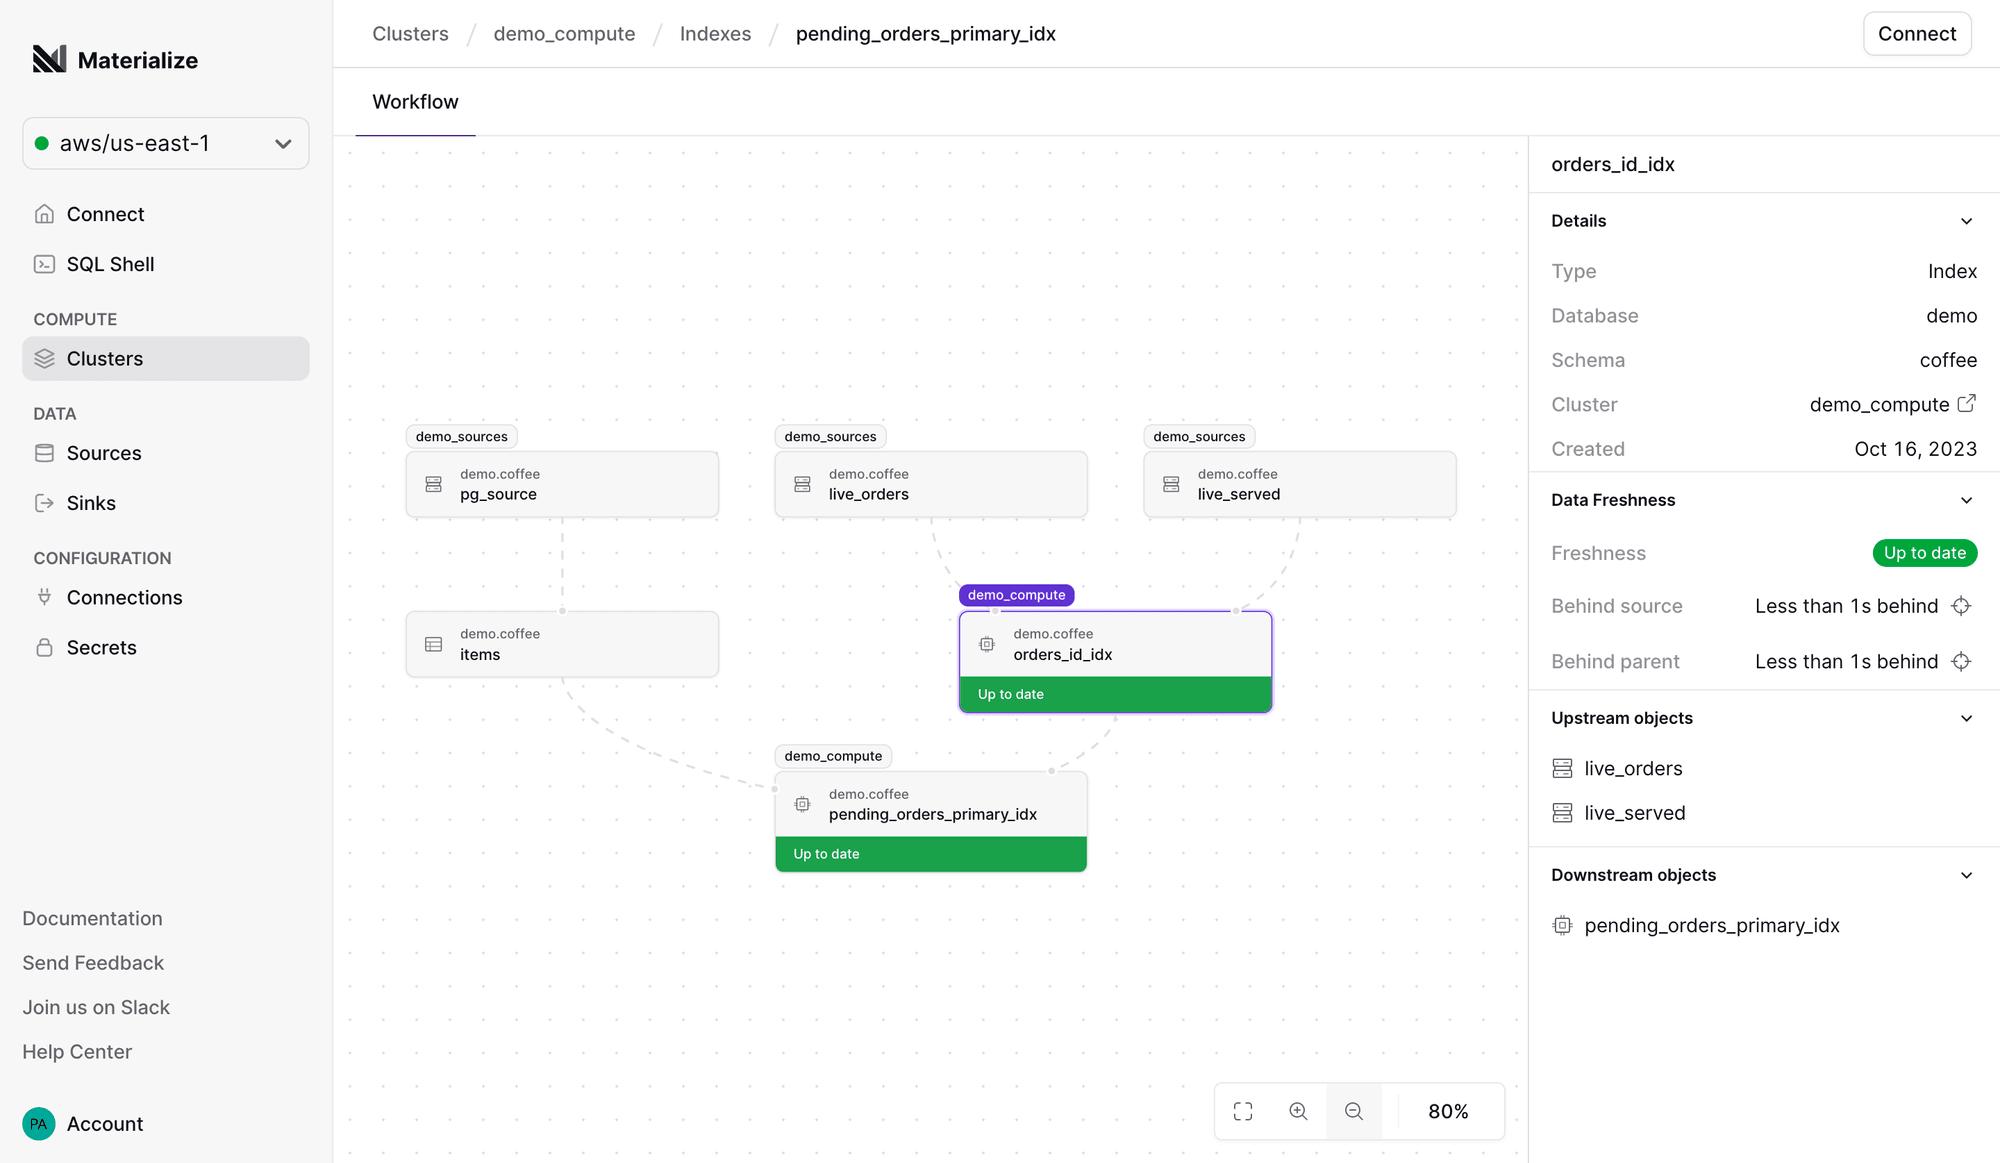
New Workflow graph 👀
11.07.2023
The days of fiddling with the system catalog to understand why your queries are laggy or unresponsive are over! With the new Workflow graph freshly available in the Materialize console, you can get a visual overview of the (resource-consuming) dependencies for an object, as well as track the freshness of its data.

Experiencing unexpected query latency? Not getting results back at all? Open up the Workflow tab for the offending object, and the graph will help you pinpoint where the bottleneck is being introduced.

Before you start: this feature applies to all object types that require Materialize to do some work (i.e. sources, indexes and materialized views), but won't give you an overview of the whole data model — at least, not yet! If you're looking for a full-blown lineage graph, we recommend checking out dbt and its documentation features for the time being.