Improved performance for temporal filters
11.27.2024
In Materialize, temporal filters let you implement a common SQL pattern: time windowing. This is useful to reduce the amount of state Materialize has to keep track of when handling append-only workloads (i.e., with data that grows unboundedly) by automatically expiring old data.
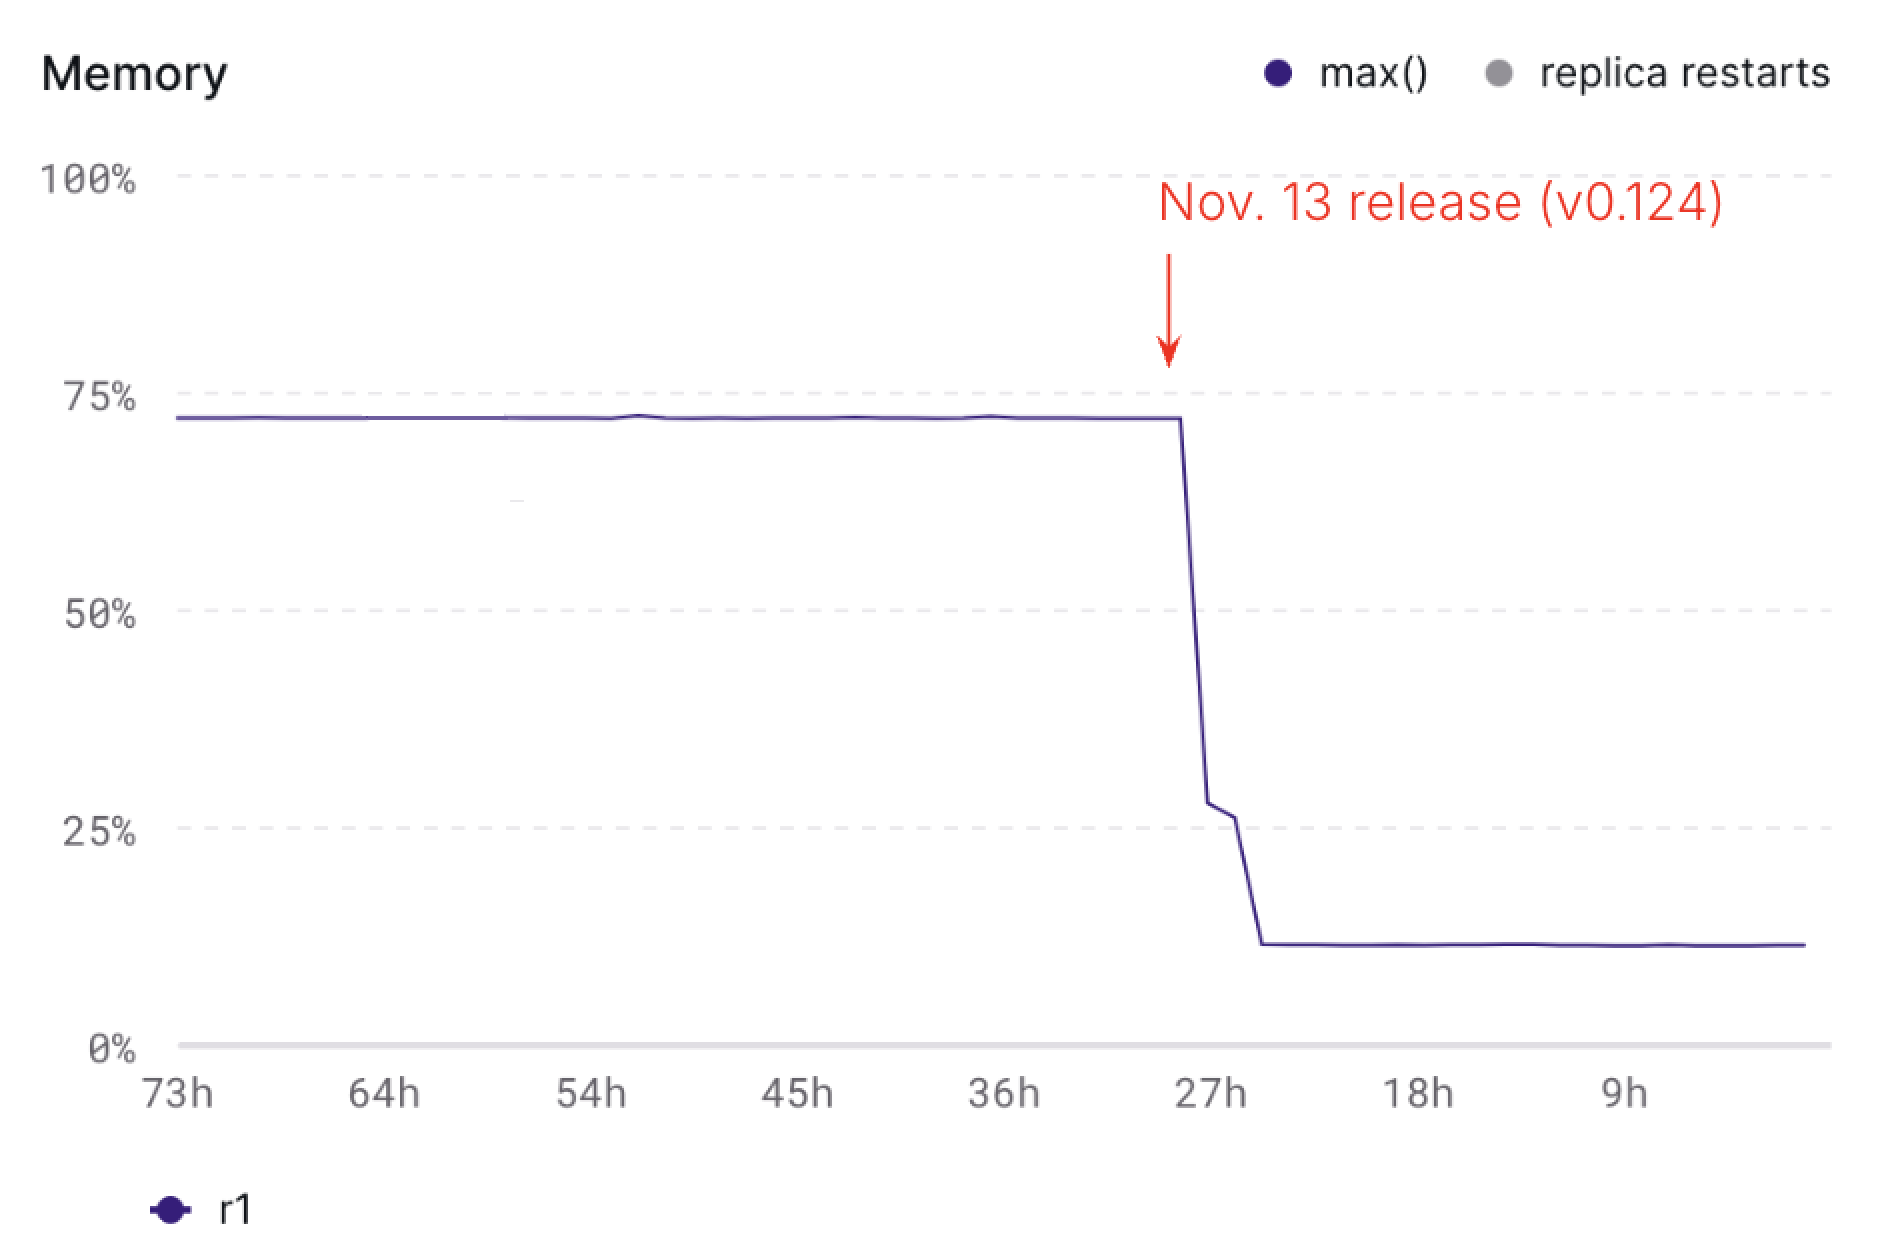
Like everything, handling the yet-to-be-expired data in a temporal filter has a cost: memory and CPU. 💀 The good news is that we've recently rolled out an optimization to the temporal filter implementation that significantly reduced memory utilization across all environments running these workloads — some even seeing a decrease of over 50%. Now, the Materialize runtime knows to use persistent storage (rather than active memory or local disk) to stash this state until it's needed.
What does this mean to you?
If you're running append-only workloads and wide-timespan temporal filters, you should've noticed a drop in resource utilization in your environment that can look as dramatic as this:

This drop in resource utilization means that you can scale down any clusters that are now overprovisioned to run these workloads! This also allows you to bring in new workloads with much wider temporal filters than before without an increase in cost.
How can you check your environment?
In the Materialize Console, click on the Clusters tab in the side navigation bar and drill into any cluster that is running a workload fitting the characteristics described in this post. Set the date range picker to Last 14 Days and check the memory chart under Resource Usage.
For more details and best practices on how to use temporal filters in Materialize, check out this blog post and the documentation on SQL patterns.