Changelog
Console: Query Lifecycle Overview
05.06.2025
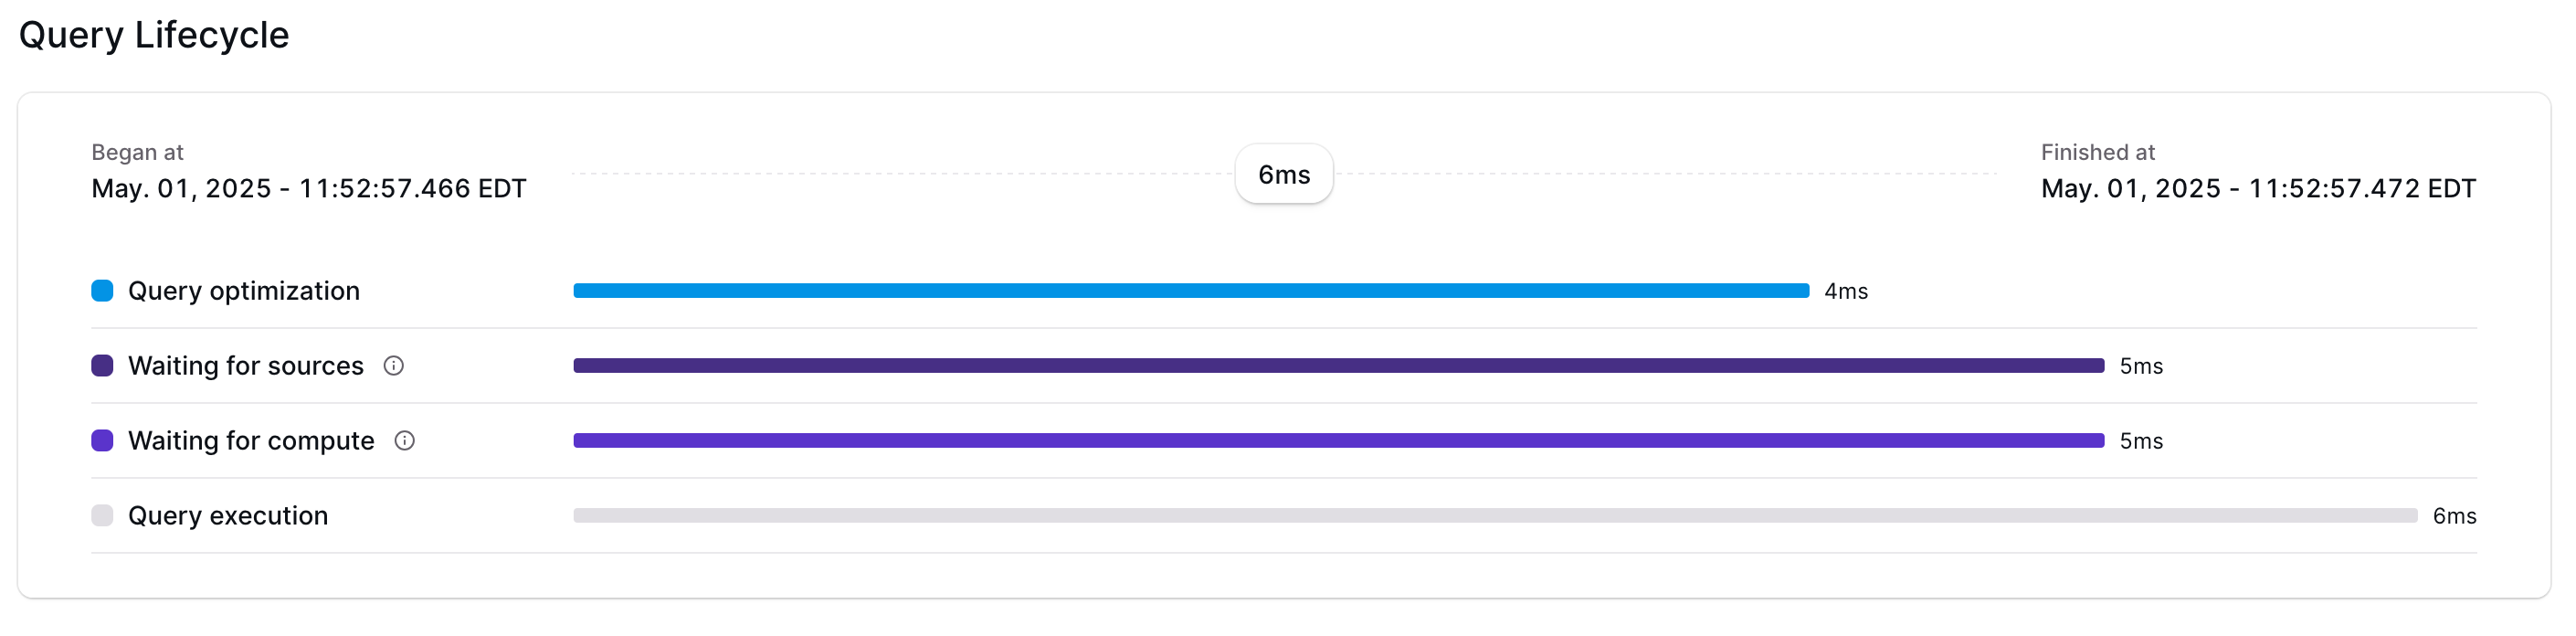
Ever wonder where your queries are spending most of their time? ️ With the new Query Lifecycle view in the Materialize Console, you can now break down the end-to-end latency of any executed query into actionable stages:
- Query optimization: time spent parsing, planning, and optimizing your SQL
- Waiting for sources: time spent waiting for source dependencies to become up-to-date
- Waiting for compute: time spent waiting for indexes / materialized views to become up-to-date
- Query execution: actual execution of the physical plan
How to use it
- Open up the Console
- Select the Query History page
- Click on any query to view its execution status and lifecycle
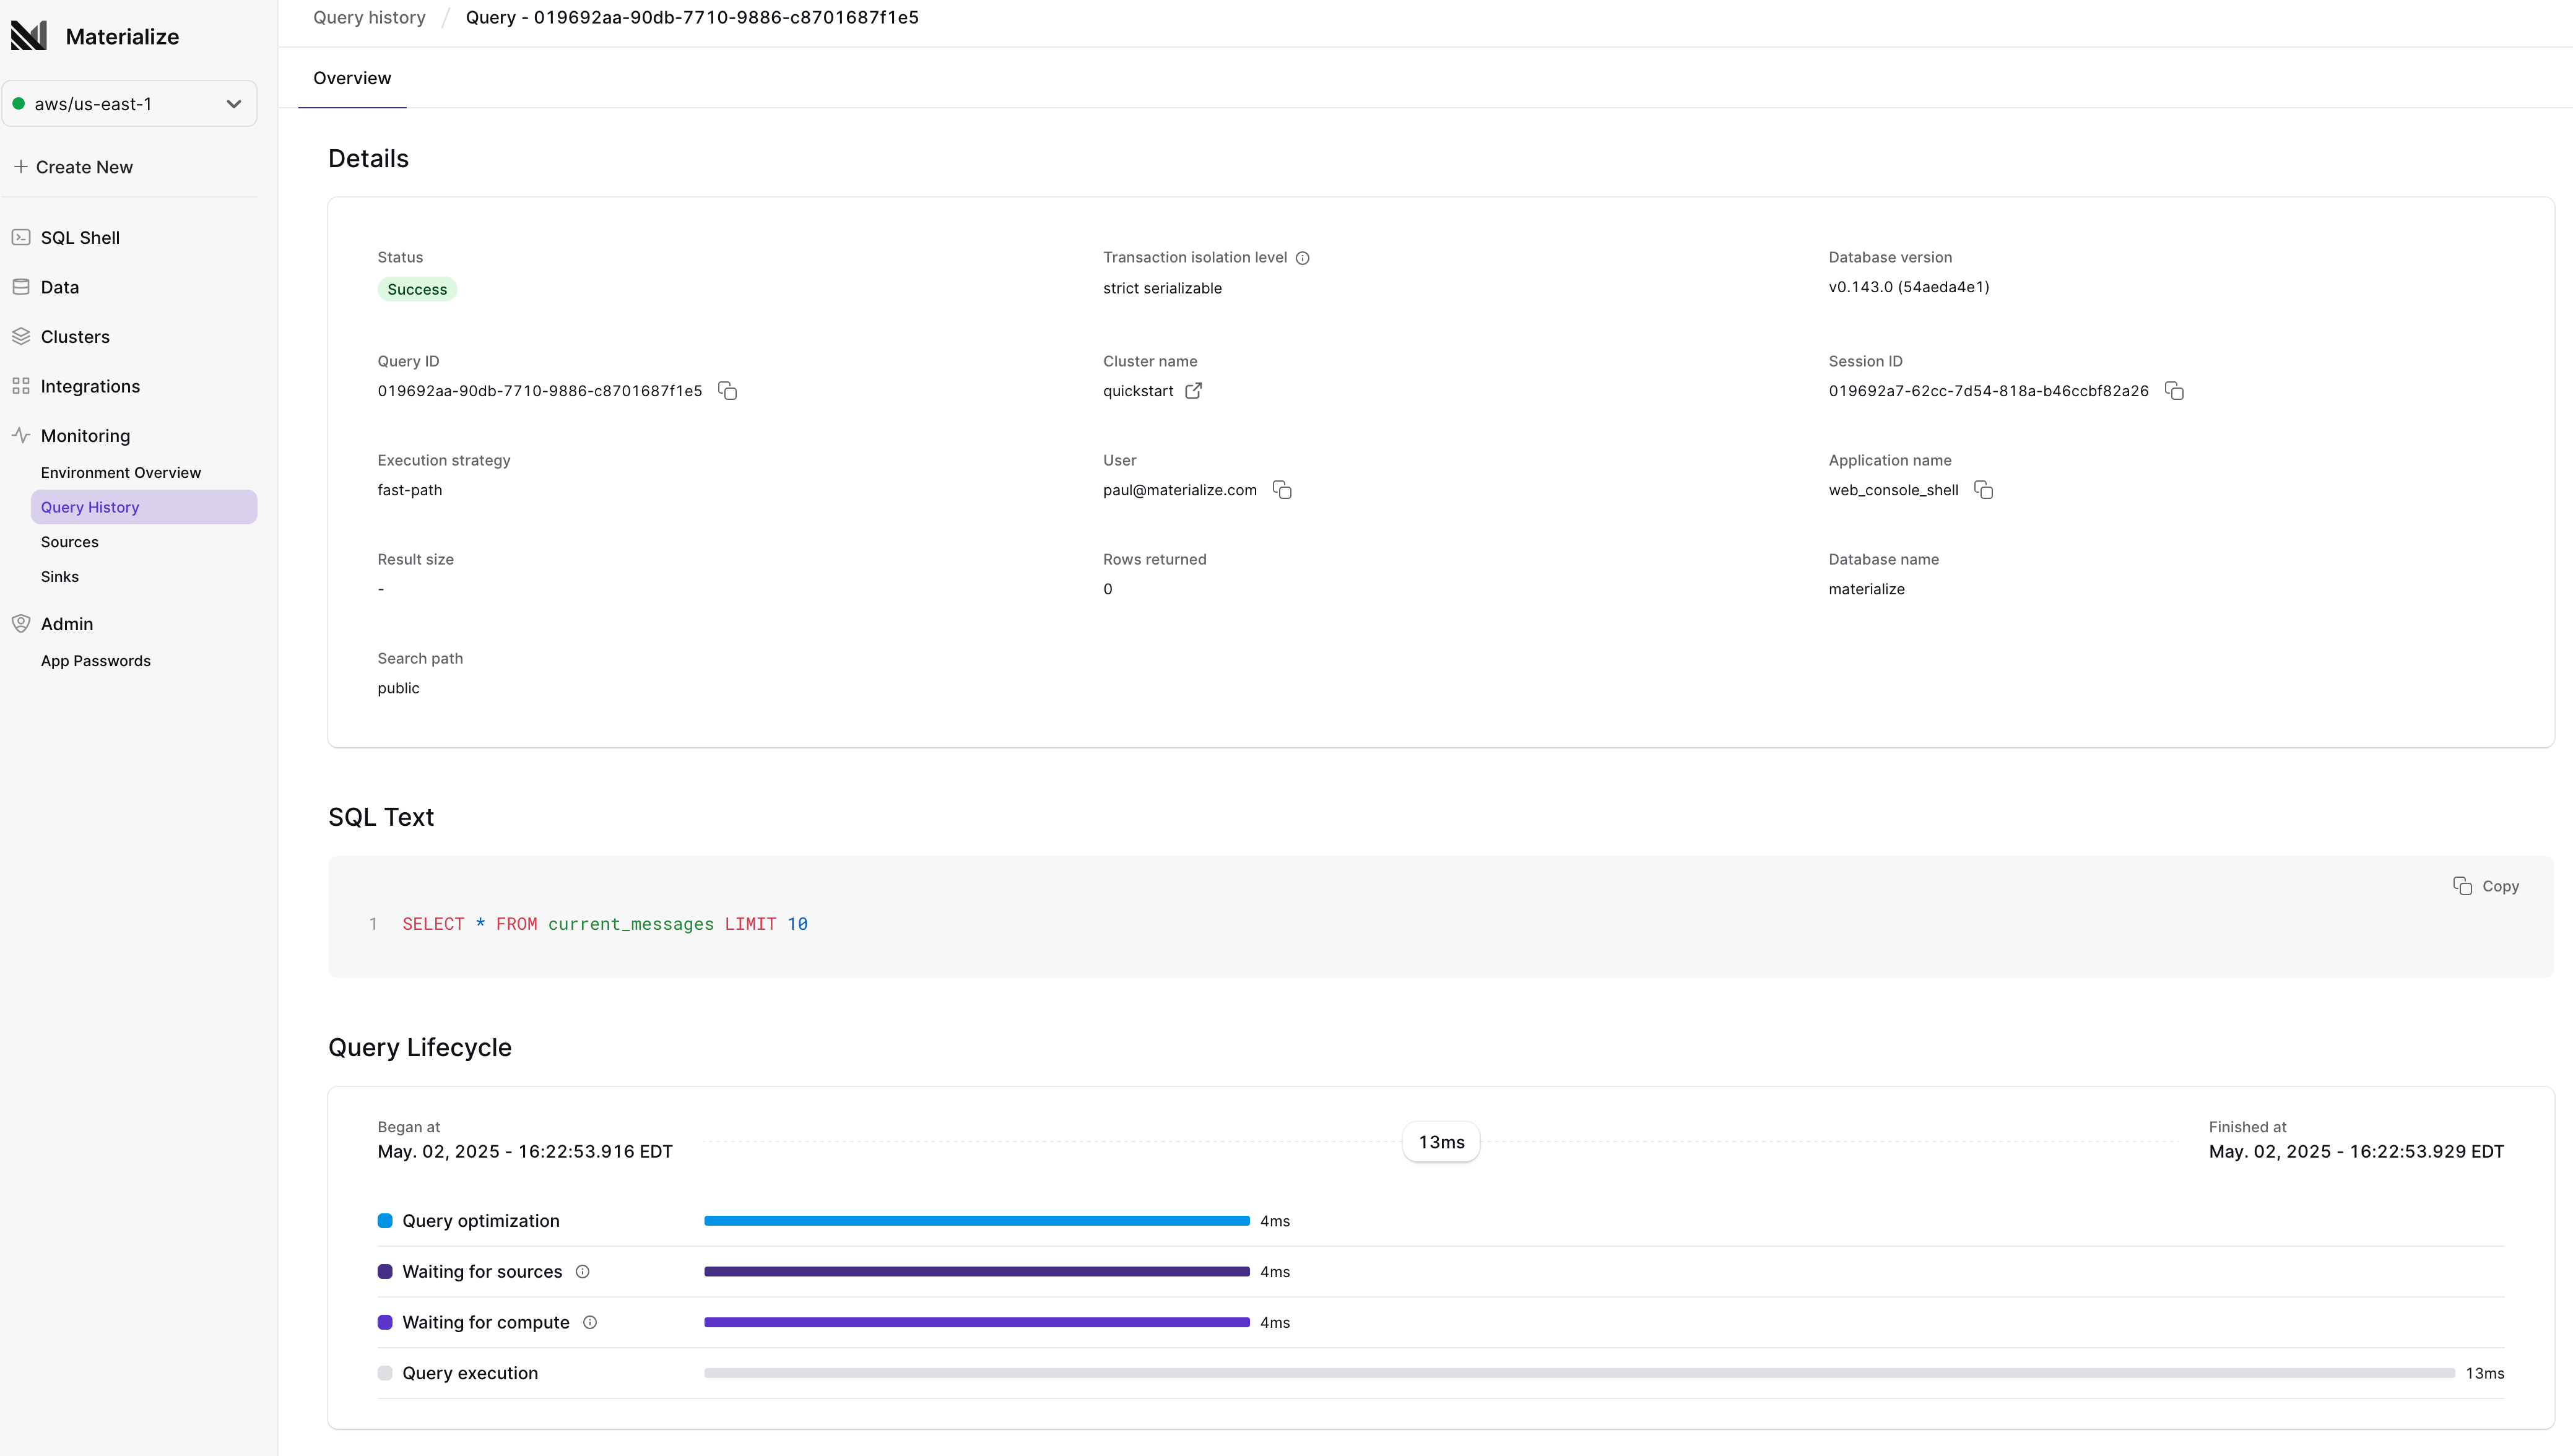
Use these insights to identify bottlenecks in query execution, refine your SQL and indexes, and fine-tune cluster resourcing.
Dive in today and get full visibility into where your queries spend their time—so you can optimize, debug, and deliver faster experiences 🚀