Memory Utilization in the Console Post-Swap
10.08.2025
In case you missed it (more in-depth blog post), we released a major change to how Materialize manages memory. As promised last month, we’ve updated our Console to improve monitoring capabilities.
As a refresher, now that clusters are backed by swap, we no longer differentiate between memory and disk. To make this concept easier to understand, we’ve introduced a new Memory Utilization metric, which is simply just memory + disk.
The maximum Memory Utilization is capped at 100%, which means your cluster replica has reached its capacity. Once you reach 100%, it will be terminated due to it being out of memory (OOM) and will auto-restart. It may loop in this state until peak memory usage is reduced or the cluster is scaled up. Anytime a cluster is nearing 100% Memory Utilization, there is potential for freshness degradation due to additional disk being accessed via swap.
Going forward, we recommend setting the following thresholds in your preferred monitoring tool:
- Warning: 80%. At this level of memory utilization, you should be alerted that your memory utilization is reaching near capacity.
- Alert: 90%. At this level of memory utilization, the cluster is nearly at capacity. This may signal it’s time to alter the cluster size to continue supporting your workload.
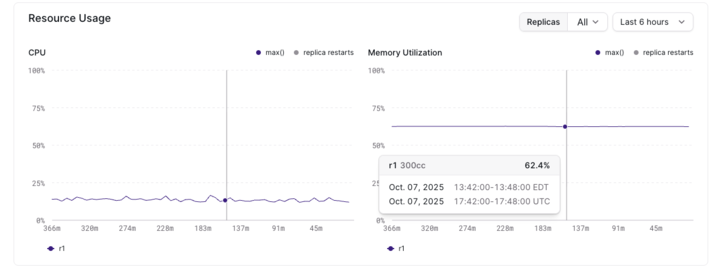
For Cloud customers, we’ve updated the Console to reflect these changes. Within a specific cluster’s Cluster Overview page, we’ve replaced the Memory and Disk graphs with a combined Memory Utilization graph.
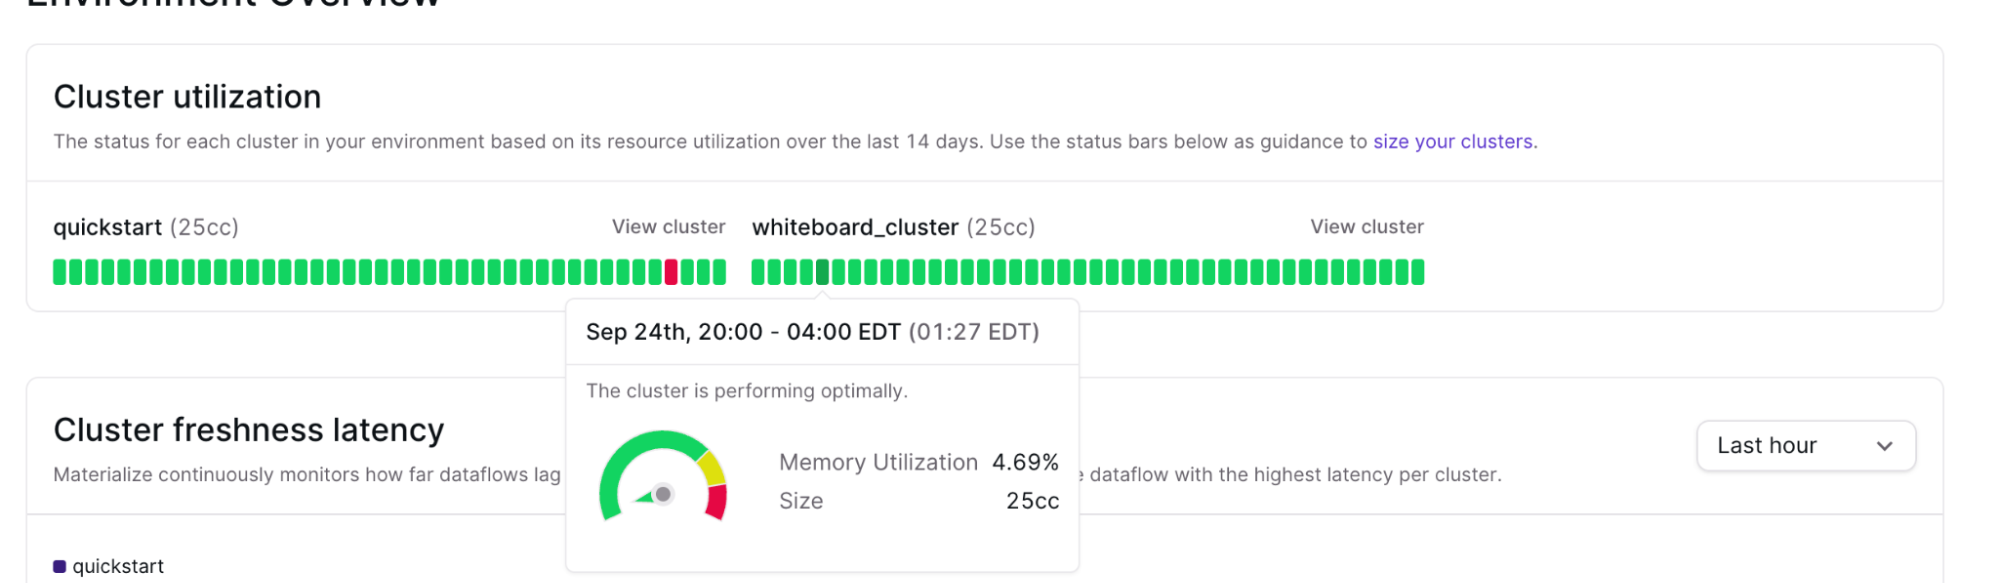
The Environment Overview page in the Console will also display Memory Utilization (Memory + Disk) of your cluster.
If you are a Self-Managed user, stay tuned on our next release which will include the Console updates for your local deployment. 👀
We are also in the process of updating our system tables to make the metric calculation more seamless.
Any additional questions? Please ask Matty (via the chatbot in the right hand corner of our website) or contact support to be connected with our team.