Dataflow troubleshooting
View as MarkdownIf you’re unable to troubleshoot your issue using the Ingest data
and Transform data troubleshooting guides,
going a level deeper in the stack might be needed. This guide collects common
questions around dataflows to help you troubleshoot your queries.
Dataflows: mental model and basic terminology
When you create a materialized view, an index, or issue an ad-hoc query, Materialize creates a so-called dataflow. A dataflow consists of instructions on how to respond to data input and to changes to that data. Once executed, the dataflow computes the result of the SQL query, waits for updates from the sources, and then incrementally updates the query results when new data arrives.
Materialize dataflows act on collections of data. To provide fast access to the changes to individual records, the records can be stored in an indexed representation called arrangements. Arrangements can be manually created by users on views by creating an index on the view. But they are also used internally in dataflows, for instance, when joining relations.
Translating SQL to dataflows
To make these concepts a bit more tangible, let’s look at the example from the getting started guide.
CREATE SOURCE auction_house
  FROM LOAD GENERATOR AUCTION
  (TICK INTERVAL '1s', AS OF 100000)
  FOR ALL TABLES;

CREATE MATERIALIZED VIEW num_bids AS
  SELECT auctions.item, count(bids.id) AS number_of_bids
  FROM bids
  JOIN auctions ON bids.auction_id = auctions.id
  WHERE bids.bid_time < auctions.end_time
  GROUP BY auctions.item;

CREATE INDEX num_bids_idx ON num_bids (item);
The query of the materialized view joins the relations bids and auctions,
groups by auctions.item and determines the number of bids per auction. To
understand how this SQL query is translated to a dataflow, we can use
EXPLAIN PLAN to display the
plan used to evaluate the join.
EXPLAIN MATERIALIZED VIEW num_bids;
                               Optimized Plan
-----------------------------------------------------------------------------
 materialize.public.num_bids:                                               +
   Reduce group_by=[#0{item}] aggregates=[count(*)] // { arity: 2 }         +
     Project (#3) // { arity: 1 }                                           +
       Filter (#1{bid_time} < #4{end_time}) // { arity: 5 }                 +
         Join on=(#0{auction_id} = #2{id}) type=differential // { arity: 5 }+
           ArrangeBy keys=[[#0{auction_id}]] // { arity: 2 }                +
             Project (#2, #4) // { arity: 2 }                               +
               ReadStorage materialize.public.bids // { arity: 5 }          +
           ArrangeBy keys=[[#0{id}]] // { arity: 3 }                        +
             Project (#0{id}, #2{end_time}, #3) // { arity: 3 }             +
               ReadStorage materialize.public.auctions // { arity: 4 }      +
                                                                            +
 Source materialize.public.auctions                                         +
 Source materialize.public.bids                                             +
                                                                            +
 Target cluster: quickstart                                                 +

(1 row)
The plan describes the specific operators that are used to evaluate the query.
Some of these operators resemble relational algebra or map reduce style
operators (Filter, Join, Project). Others are specific to Materialize
(ArrangeBy, ReadStorage).
In general, a high level understanding of what these operators do is sufficient
for effective debugging: Filter filters records, Join joins records from
two or more inputs, Map applies a function to transform records, etc. You can
find more details on these operators in the EXPLAIN PLAN documentation.
But it’s not important to have a deep understanding of all these operators for
effective debugging.
Behind the scenes, the operator graph is turned into a dataflow. The dataflow is
organized in a hierarchical structure that contains operators and regions,
which define a hierarchy on the operators. In our example, the dataflow
contains an InputRegion, a BuildRegion, and a region for the sink.
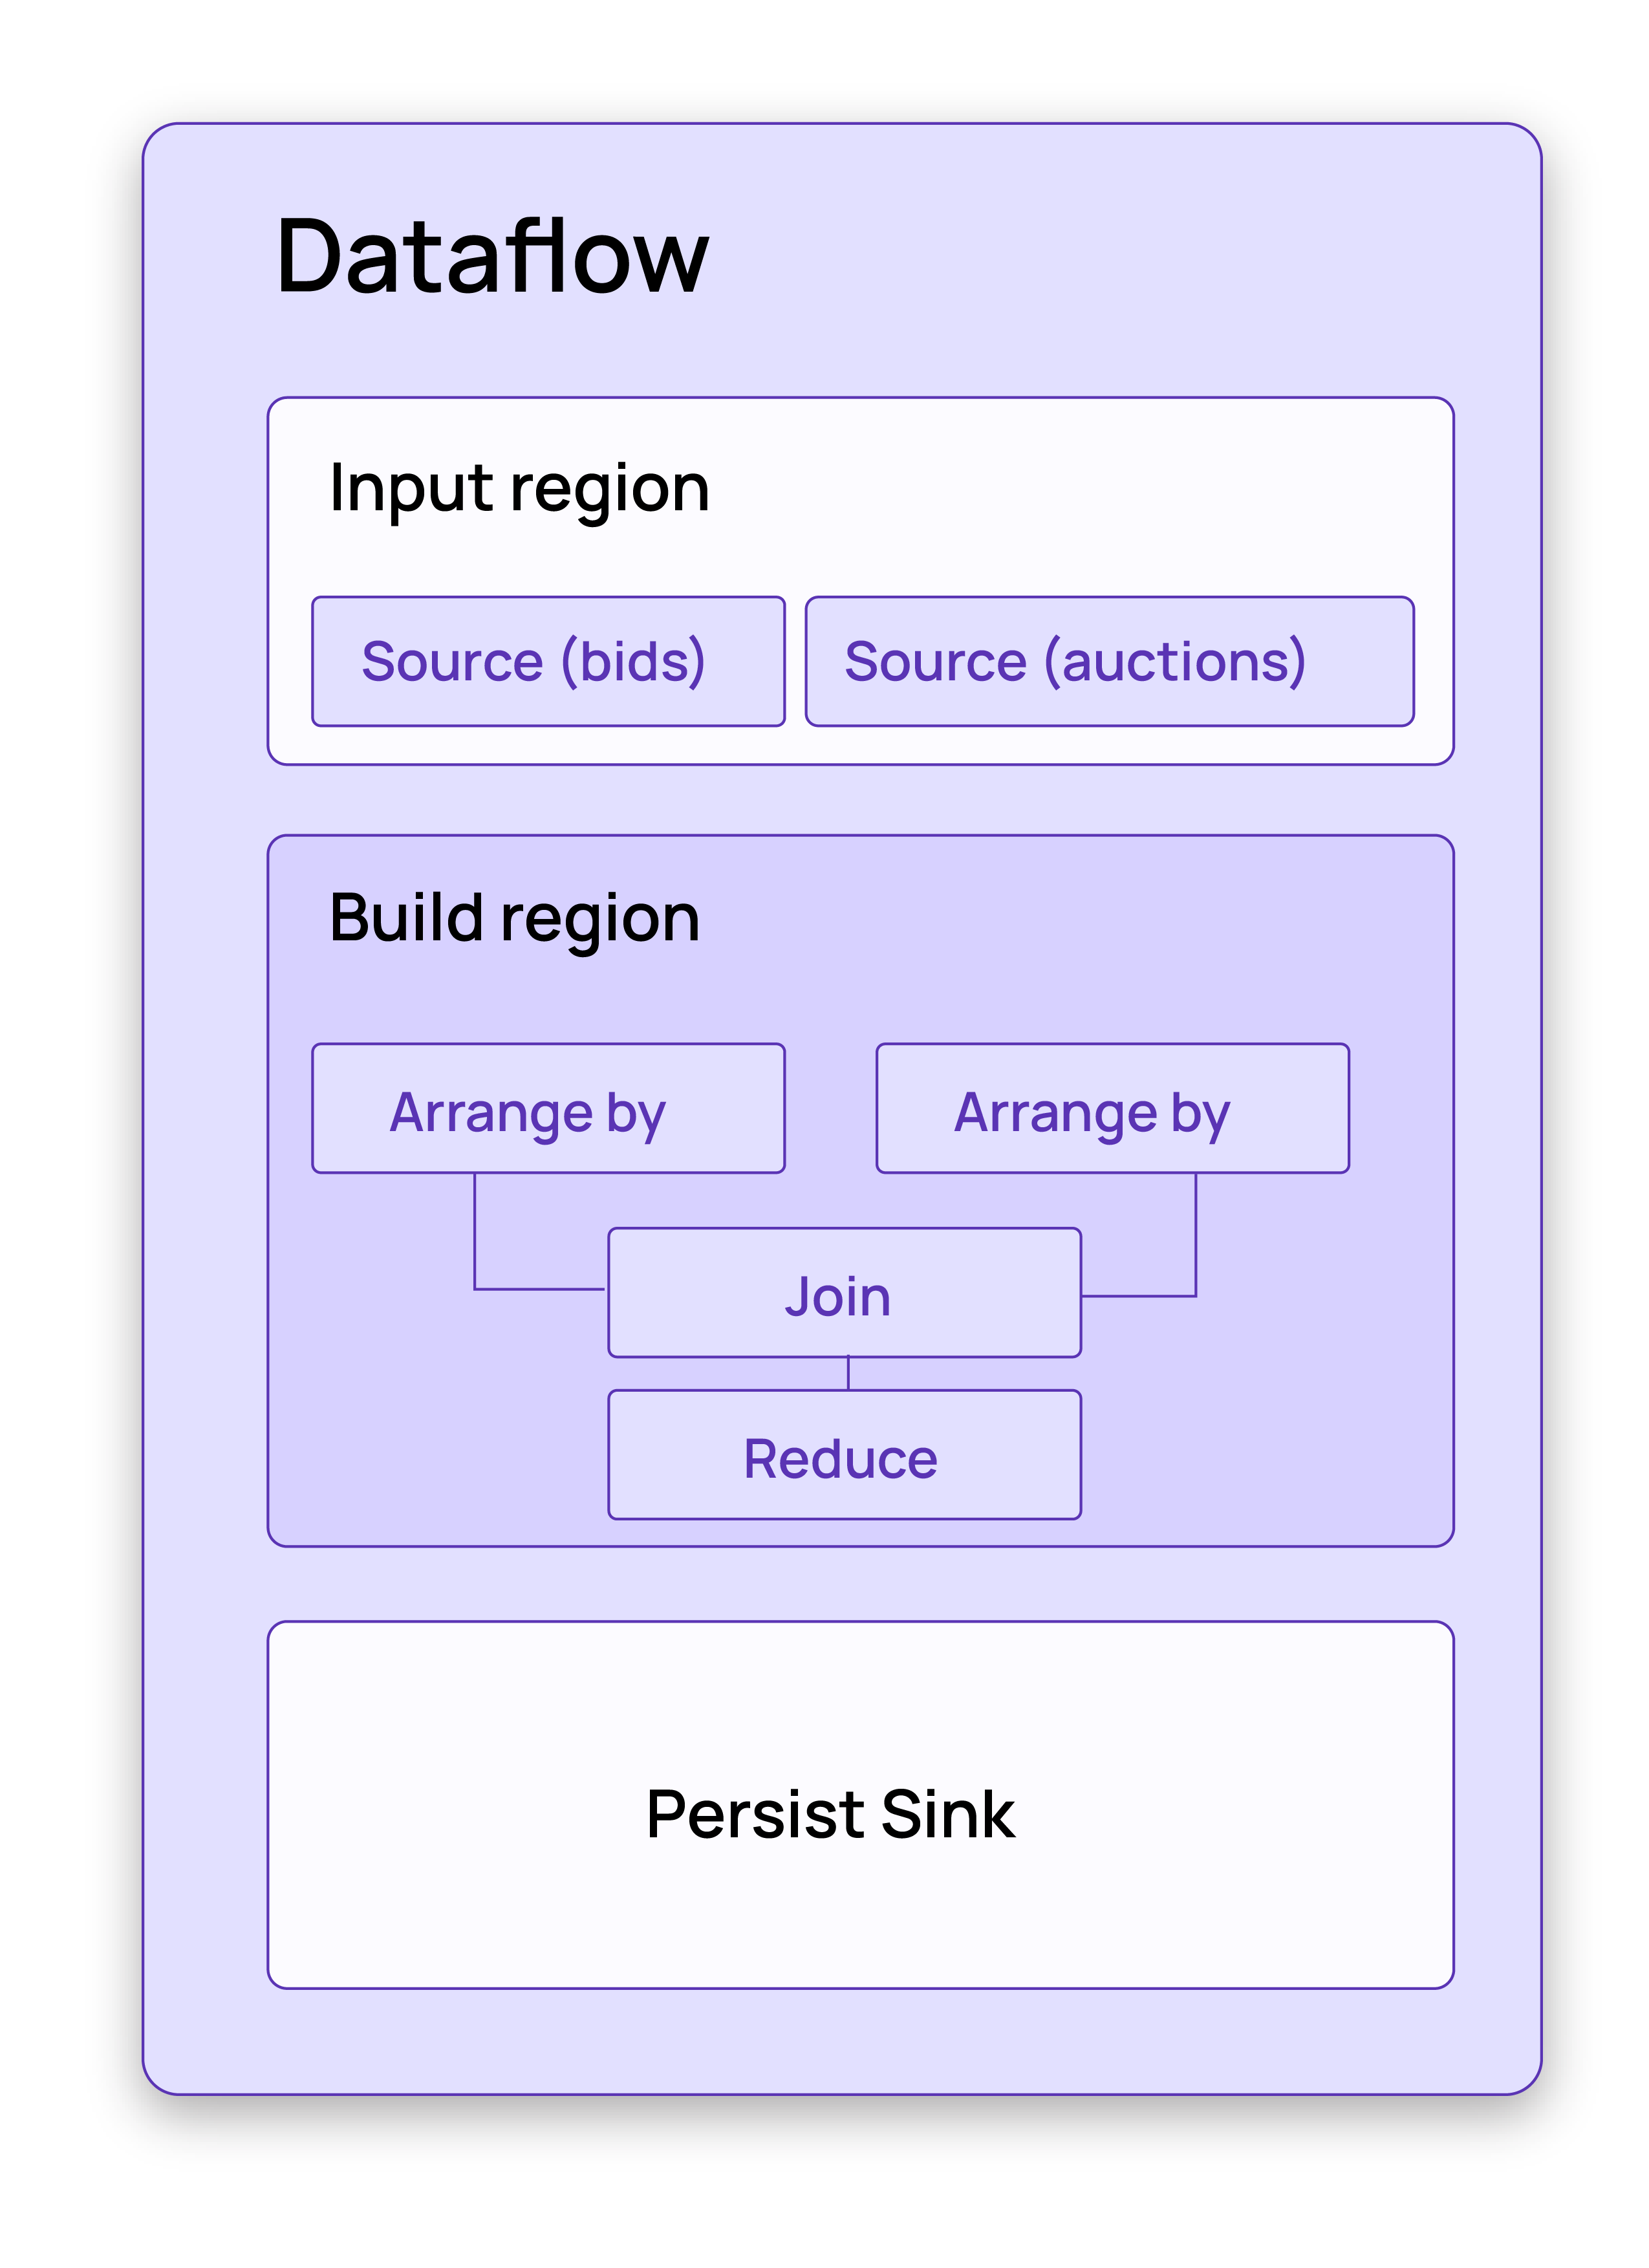
Again, it’s not too important for our purposes to understand what these regions do and how they are used to structure the operator graph. For our purposes it’s just important to know than that they define a hierarchy on the operators.
The system catalog and introspection relations
Materialize collects a lot of useful information about the dataflows and operators in the system catalog in introspection relations. The introspection relations are useful to troubleshoot and understand what is happening under the hood when Materialize is not behaving as expected. However, it is important to understand that most of the statistics we need for troubleshooting purposes are specific to the cluster that is running the queries we want to debug.
cluster and cluster_replica
configuration parameters.
Where is Materialize spending compute time?
Materialize spends time in various dataflow operators. Dataflows are created to maintain materialized views or indexes. In addition, temporary dataflow will be created for ad-hoc queries that don’t just make a lookup to an existing index.
If Materialize is taking more time to update results than you expect, you can identify which operators take the largest total amount of time.
Identifying expensive dataflows
To understand which dataflow is taking the most time we can query the
mz_scheduling_elapsed relation. The elapsed_time metric shows the absolute
time the dataflows was busy since the system started and the dataflow was
created.
-- Extract raw elapsed time information for dataflows
SELECT
    mdo.id,
    mdo.name,
    mse.elapsed_ns / 1000 * '1 MICROSECONDS'::interval AS elapsed_time
FROM mz_introspection.mz_scheduling_elapsed AS mse,
    mz_introspection.mz_dataflow_operators AS mdo,
    mz_introspection.mz_dataflow_addresses AS mda
WHERE mse.id = mdo.id AND mdo.id = mda.id AND list_length(address) = 1
ORDER BY elapsed_ns DESC;
 id  |                  name                  |  elapsed_time
-----+----------------------------------------+-----------------
 354 | Dataflow: materialize.qck.num_bids     | 02:05:25.756836
 578 | Dataflow: materialize.qck.num_bids_idx | 00:15:04.838741
 (2 rows)
These results show that Materialize spends the most time keeping the
materialized view num_bids up to date, followed by the work on the index
avg_bids_idx.
Identifying expensive operators in a dataflow
The previous query is a good starting point to get an overview of the work happening in the cluster because it only returns dataflows.
The mz_scheduling_elapsed relation also contains details for regions and
operators. Removing the condition list_length(address) = 1 will include the
regions and operators in the result. But be aware that every row shows
aggregated times for all the elements it contains. The elapsed_time reported
for the dataflows above also includes the elapsed time for all the regions and
operators they contain.
But because the parent-child relationship is not always obvious, the results
containing a mixture of dataflows, regions, and operators can be a bit hard to
interpret. The following query therefore only returns operators from the
mz_scheduling_elapsed relation. You can further drill down by adding a filter
condition that matches the name of a specific dataflow.
SELECT
    mdod.id,
    mdod.name,
    mdod.dataflow_name,
    mse.elapsed_ns / 1000 * '1 MICROSECONDS'::interval AS elapsed_time
FROM mz_introspection.mz_scheduling_elapsed AS mse,
    mz_introspection.mz_dataflow_addresses AS mda,
    mz_introspection.mz_dataflow_operator_dataflows AS mdod
WHERE
    mse.id = mdod.id AND mdod.id = mda.id
    -- exclude regions and just return operators
    AND mda.address NOT IN (
        SELECT DISTINCT address[:list_length(address) - 1]
        FROM mz_introspection.mz_dataflow_addresses
    )
ORDER BY elapsed_ns DESC;
 id  |                      name                       |             dataflow_name              |  elapsed_time
-----+-------------------------------------------------+----------------------------------------+-----------------
 431 | ArrangeBy[[Column(0)]]                          | Dataflow: materialize.qck.num_bids     | 01:12:58.964875
 442 | ArrangeBy[[Column(0)]]                          | Dataflow: materialize.qck.num_bids     | 00:06:06.080178
 528 | shard_source_fetch(u517)                        | Dataflow: materialize.qck.num_bids     | 00:04:04.076344
 594 | shard_source_fetch(u517)                        | Dataflow: materialize.qck.num_bids_idx | 00:03:34.803234
 590 | persist_source_backpressure(backpressure(u517)) | Dataflow: materialize.qck.num_bids_idx | 00:03:33.626036
 400 | persist_source_backpressure(backpressure(u510)) | Dataflow: materialize.qck.num_bids     | 00:03:03.575832
...
From the results of this query we can see that most of the elapsed time of the dataflow is caused by the time it takes to maintain the updates in one of the arrangements of the dataflow of the materialized view.
Debugging expensive dataflows and operators
A large class of problems can be identified by using elapsed_time
to estimate the most expensive dataflows and operators. However, elapsed_time
contains all work since the operator or dataflow was first created. Sometimes,
a lot of work happens initially when the operator is created, but later on it
takes only little continuous effort. If you want to see what operator is taking
the most time right now, the elapsed_time metric is not enough.
The relation mz_compute_operator_durations_histogram also tracks the time
operators are busy, but instead of aggregating elapsed_time since an operator
got created, it tracks how long each operator was scheduled at a time in a
histogram. This information can show you two things: operators that block
progress for others and operators that are currently doing work.
If there is a very expensive operator that blocks progress for all other operators, it will become visible in the histogram. The offending operator will be scheduled in much longer intervals compared to other operators, which reflects in the histogram as larger time buckets.
-- Extract raw scheduling histogram information for operators
WITH histograms AS (
    SELECT
        mdod.id,
        mdod.name,
        mdod.dataflow_name,
        mcodh.count,
        mcodh.duration_ns / 1000 * '1 MICROSECONDS'::interval AS duration
    FROM mz_introspection.mz_compute_operator_durations_histogram AS mcodh,
        mz_introspection.mz_dataflow_addresses AS mda,
        mz_introspection.mz_dataflow_operator_dataflows AS mdod
    WHERE
        mcodh.id = mdod.id
        AND mdod.id = mda.id
        -- exclude regions and just return operators
        AND mda.address NOT IN (
            SELECT DISTINCT address[:list_length(address) - 1]
            FROM mz_introspection.mz_dataflow_addresses
        )

)

SELECT *
FROM histograms
WHERE duration > '100 millisecond'::interval
ORDER BY duration DESC;
 id  |                 name                 |             dataflow_name              | count |    duration
-----+--------------------------------------+----------------------------------------+-------+-----------------
 408 | persist_source::decode_and_mfp(u510) | Dataflow: materialize.qck.num_bids     |     1 | 00:00:01.073741
 408 | persist_source::decode_and_mfp(u510) | Dataflow: materialize.qck.num_bids     |     1 | 00:00:00.53687
 374 | persist_source::decode_and_mfp(u509) | Dataflow: materialize.qck.num_bids     |     1 | 00:00:00.268435
 408 | persist_source::decode_and_mfp(u510) | Dataflow: materialize.qck.num_bids     |     2 | 00:00:00.268435
 429 | FormArrangementKey                   | Dataflow: materialize.qck.num_bids     |     2 | 00:00:00.134217
 (5 rows)
Note that this relation contains a lot of information. The query therefore
filters all durations below 100 millisecond. In this example, the result of
the query shows that the longest an operator got scheduled is just over one
second. So it’s unlikely that Materialize is unresponsive because of a single
operator blocking progress for others.
The reported duration is still reporting aggregated values since the operator has been created. To get a feeling for which operators are currently doing work, you can subscribe to the changes of the relation.
-- Observe changes to the raw scheduling histogram information
COPY(SUBSCRIBE(
    WITH histograms AS (
        SELECT
            mdod.id,
            mdod.name,
            mdod.dataflow_name,
            mcodh.count,
            mcodh.duration_ns / 1000 * '1 MICROSECONDS'::interval AS duration
        FROM mz_introspection.mz_compute_operator_durations_histogram AS mcodh,
            mz_introspection.mz_dataflow_addresses AS mda,
            mz_introspection.mz_dataflow_operator_dataflows AS mdod
        WHERE
            mcodh.id = mdod.id
            AND mdod.id = mda.id
            -- exclude regions and just return operators
            AND mda.address NOT IN (
                SELECT DISTINCT address[:list_length(address) - 1]
                FROM mz_introspection.mz_dataflow_addresses
            )

    )

    SELECT *
    FROM histograms
    WHERE duration > '100 millisecond'::interval
) WITH (SNAPSHOT = false, PROGRESS)) TO STDOUT;
1691667343000	t	\N	\N	\N	\N	\N	\N
1691667344000	t	\N	\N	\N	\N	\N	\N
1691667344000	f	-1	431	ArrangeBy[[Column(0)]]	Dataflow: materialize.qck.num_bids	7673	00:00:00.104800
1691667344000	f	1	431	ArrangeBy[[Column(0)]]	Dataflow: materialize.qck.num_bids	7674	00:00:00.104800
1691667345000	t	\N	\N	\N	\N	\N	\N
...
In this way you can see that currently the only operator that is doing more than
100 milliseconds worth of work is the ArrangeBy operator from the
materialized view num_bids.
Why is Materialize using so much memory?
Arrangements take up most of Materialize’s memory use. Arrangements maintain indexes for data as it changes. These queries extract the numbers of records and the size of the arrangements. The reported records may exceed the number of logical records; the report reflects the uncompacted state.
-- Extract dataflow records and sizes
SELECT
    s.id,
    s.name,
    s.records,
    pg_size_pretty(s.size) AS size
FROM mz_introspection.mz_dataflow_arrangement_sizes AS s
ORDER BY s.size DESC;
  id   |                   name                    | records  |    size
-------+-------------------------------------------+----------+------------
 49030 | Dataflow: materialize.public.num_bids     | 10000135 | 165 MB
 49031 | Dataflow: materialize.public.num_bids_idx |       33 | 1661 bytes
If you need to drill down into individual operators, you can query
mz_arrangement_sizes instead.
-- Extract operator records and sizes
SELECT
    mdod.id,
    mdod.name,
    mdod.dataflow_name,
    mas.records,
    pg_size_pretty(mas.size) AS size
FROM mz_introspection.mz_arrangement_sizes AS mas,
    mz_introspection.mz_dataflow_operator_dataflows AS mdod
WHERE mas.operator_id = mdod.id
ORDER BY mas.size DESC;
    id    |              name               |               dataflow_name               | records |    size
----------+---------------------------------+-------------------------------------------+---------+------------
 16318351 | ArrangeBy[[Column(0)]]          | Dataflow: materialize.public.num_bids     | 8462247 | 110 MB
 16318370 | ArrangeBy[[Column(0)]]          | Dataflow: materialize.public.num_bids     | 1537865 | 55 MB
 16318418 | ArrangeAccumulable [val: empty] | Dataflow: materialize.public.num_bids     |       5 | 1397 bytes
 16318550 | ArrangeBy[[Column(0)]]          | Dataflow: materialize.public.num_bids_idx |      13 | 1277 bytes
 16318422 | ReduceAccumulable               | Dataflow: materialize.public.num_bids     |       5 | 1073 bytes
 16318426 | AccumulableErrorCheck           | Dataflow: materialize.public.num_bids     |       0 | 256 bytes
 16318559 | ArrangeBy[[Column(0)]]-errors   | Dataflow: materialize.public.num_bids_idx |       0 | 0 bytes
In the Materialize Console,
-
The Cluster Overview page displays the cluster resource utilization for a selected cluster as well as the resource intensive objects in the cluster.
-
The Environment Overview page displays the resource utilization for all your clusters. You can select a specific cluster to view its Overview page.
Is work distributed equally across workers?
Work is distributed across workers by the hash of their keys. Thus, work can become skewed if situations arise where Materialize needs to use arrangements with very few or no keys. Example situations include:
- Views that maintain order by/limit/offset
- Cross joins
- Joins where the join columns have very few unique values
Additionally, the operators that implement data sources may demonstrate skew, as they (currently) have a granularity determined by the source itself. For example, Kafka topic ingestion work can become skewed if most of the data is in only one out of multiple partitions.
-- Get operators where one worker has spent more than 2 times the average
-- amount of time spent. The number 2 can be changed according to the threshold
-- for the amount of skew deemed problematic.
SELECT
    mse.id,
    dod.name,
    mse.worker_id,
    elapsed_ns,
    avg_ns,
    elapsed_ns/avg_ns AS ratio
FROM
    mz_introspection.mz_scheduling_elapsed_per_worker mse,
    (
        SELECT
            id,
            avg(elapsed_ns) AS avg_ns
        FROM
            mz_introspection.mz_scheduling_elapsed_per_worker
        GROUP BY
            id
    ) aebi,
    mz_introspection.mz_dataflow_operator_dataflows dod
WHERE
    mse.id = aebi.id AND
    mse.elapsed_ns > 2 * aebi.avg_ns AND
    mse.id = dod.id
ORDER BY ratio DESC;
I found a problematic operator. Where did it come from?
Look up the operator in mz_dataflow_addresses. If an operator has value x at
position n, then it is part of the x subregion of the region defined by
positions 0..n-1. The example SQL query and result below shows an operator
whose id is 515 that belongs to “subregion 5 of region 1 of dataflow 21”.
SELECT * FROM mz_introspection.mz_dataflow_addresses WHERE id=515;
 id  | worker_id | address
-----+-----------+----------
 515 |      0    | {21,1,5}
Usually, it is only important to know the name of the dataflow a problematic operator comes from. Once the name is known, the dataflow can be correlated to an index or materialized view in Materialize.
Each dataflow has an operator representing the entire dataflow. The address of said operator has only a single entry. For the example operator 515 above, you can find the name of the dataflow if you can find the name of the operator whose address is just “dataflow 21.”
-- get id and name of the operator representing the entirety of the dataflow
-- that a problematic operator comes from
SELECT
    mdo.id AS id,
    mdo.name AS name
FROM
    mz_introspection.mz_dataflow_addresses mda,
    -- source of operator names
    mz_introspection.mz_dataflow_operators mdo,
    -- view containing operators representing entire dataflows
    (SELECT
      mda.id AS dataflow_operator,
      mda.address[1] AS dataflow_address
    FROM
      mz_introspection.mz_dataflow_addresses mda
    WHERE
      list_length(mda.address) = 1) dataflows
WHERE
    mda.id = 515
    AND mda.address[1] = dataflows.dataflow_address
    AND mdo.id = dataflows.dataflow_operator;
I dropped an index, why haven’t my plans and dataflows changed?
It’s likely that your index has downstream dependencies. If an index has dependent objects downstream, its underlying dataflow will continue to be maintained and take up resources until all dependent object are dropped or altered, or Materialize is restarted.
To check if there are residual dataflows on a specific cluster, run the following query:
SET CLUSTER TO <cluster_name>;

SELECT ce.export_id AS dropped_index_id,
       s.name AS dropped_index_name,
       s.id AS dataflow_id
FROM mz_internal.mz_dataflow_arrangement_sizes s
JOIN mz_internal.mz_compute_exports ce ON ce.dataflow_id = s.id
LEFT JOIN mz_catalog.mz_objects o ON o.id = ce.export_id
WHERE o.id IS NULL;
You can then use the dropped_index_id object identifier to list the downstream
dependencies of the residual dataflow, using:
SELECT do.id AS dependent_object_id,
       do.name AS dependent_object_name,
       db.name AS dependent_object_database,
       s.name AS dependent_object_schema
FROM mz_internal.mz_compute_dependencies cd
LEFT JOIN mz_catalog.mz_objects do ON cd.object_id = do.id
LEFT JOIN mz_catalog.mz_schemas s ON do.schema_id = s.id
LEFT JOIN mz_catalog.mz_databases db ON s.database_id = db.id
WHERE cd.dependency_id = <dropped_index_id>;
To force a re-plan of the downstream objects that doesn’t consider the dropped index, you have to drop and recreate all downstream dependencies.