Monitoring data ingestion
View as MarkdownMonitoring the snapshotting progress
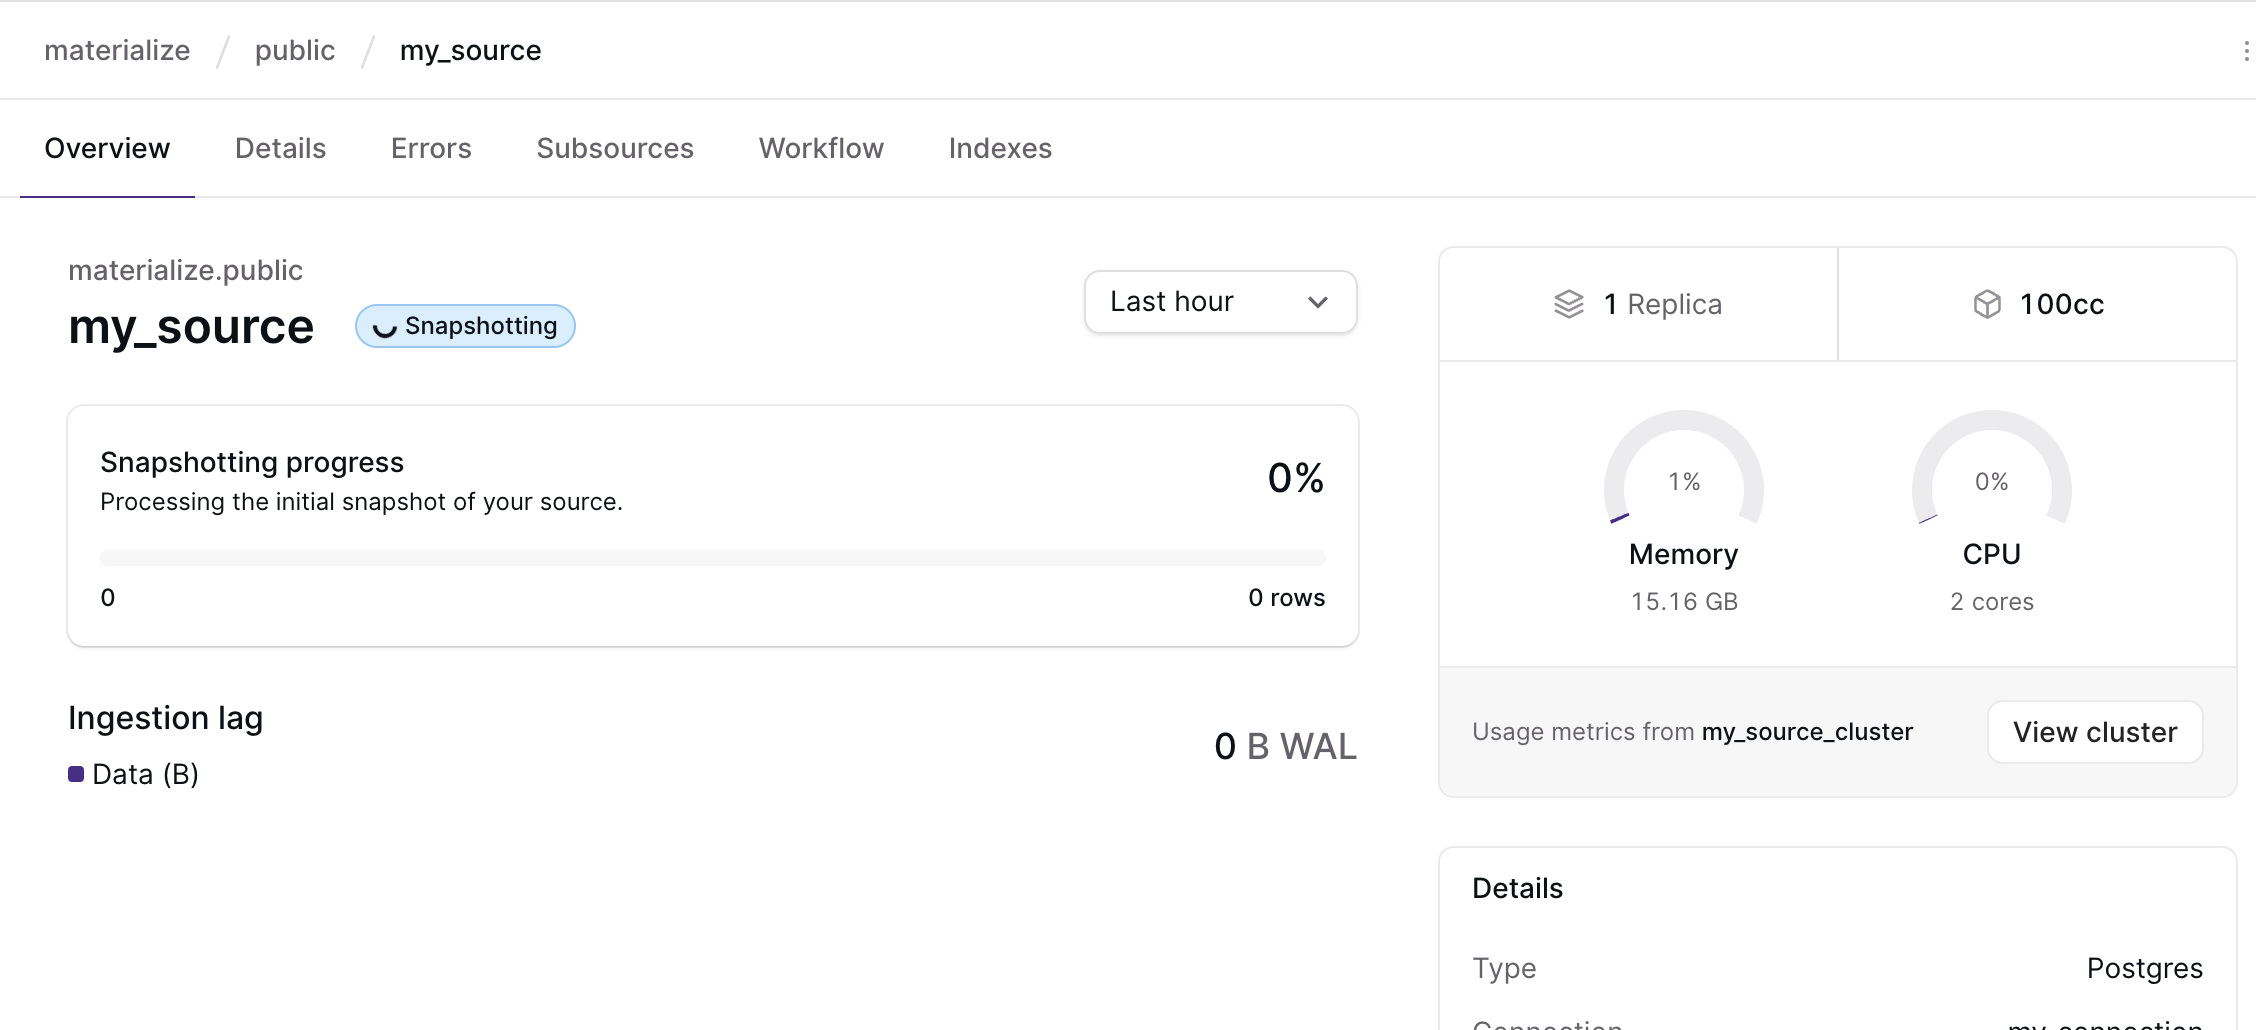
In the Materialize Console, the Overview page for the source displays the snapshotting progress.

Alternatively, you can run a query to monitor its progress.
SELECT
	o.name,
	s.snapshot_records_staged,
	s.snapshot_records_known,
	round(100.0 * s.snapshot_records_staged / NULLIF(s.snapshot_records_known, 0), 2) AS snapshot_completed_pct
FROM mz_internal.mz_source_statistics AS s
INNER JOIN mz_objects AS o ON (s.id = o.id)
WHERE NOT s.snapshot_committed;
It’s also important to monitor CPU and memory utilization for the cluster hosting the source during snapshotting. If there are signs of resource exhaustion, you may need to resize the cluster.
In the Materialize Console, the Overview page for the source displays the CPU and memory utilization. See image above.
Monitoring hydration/data freshness status
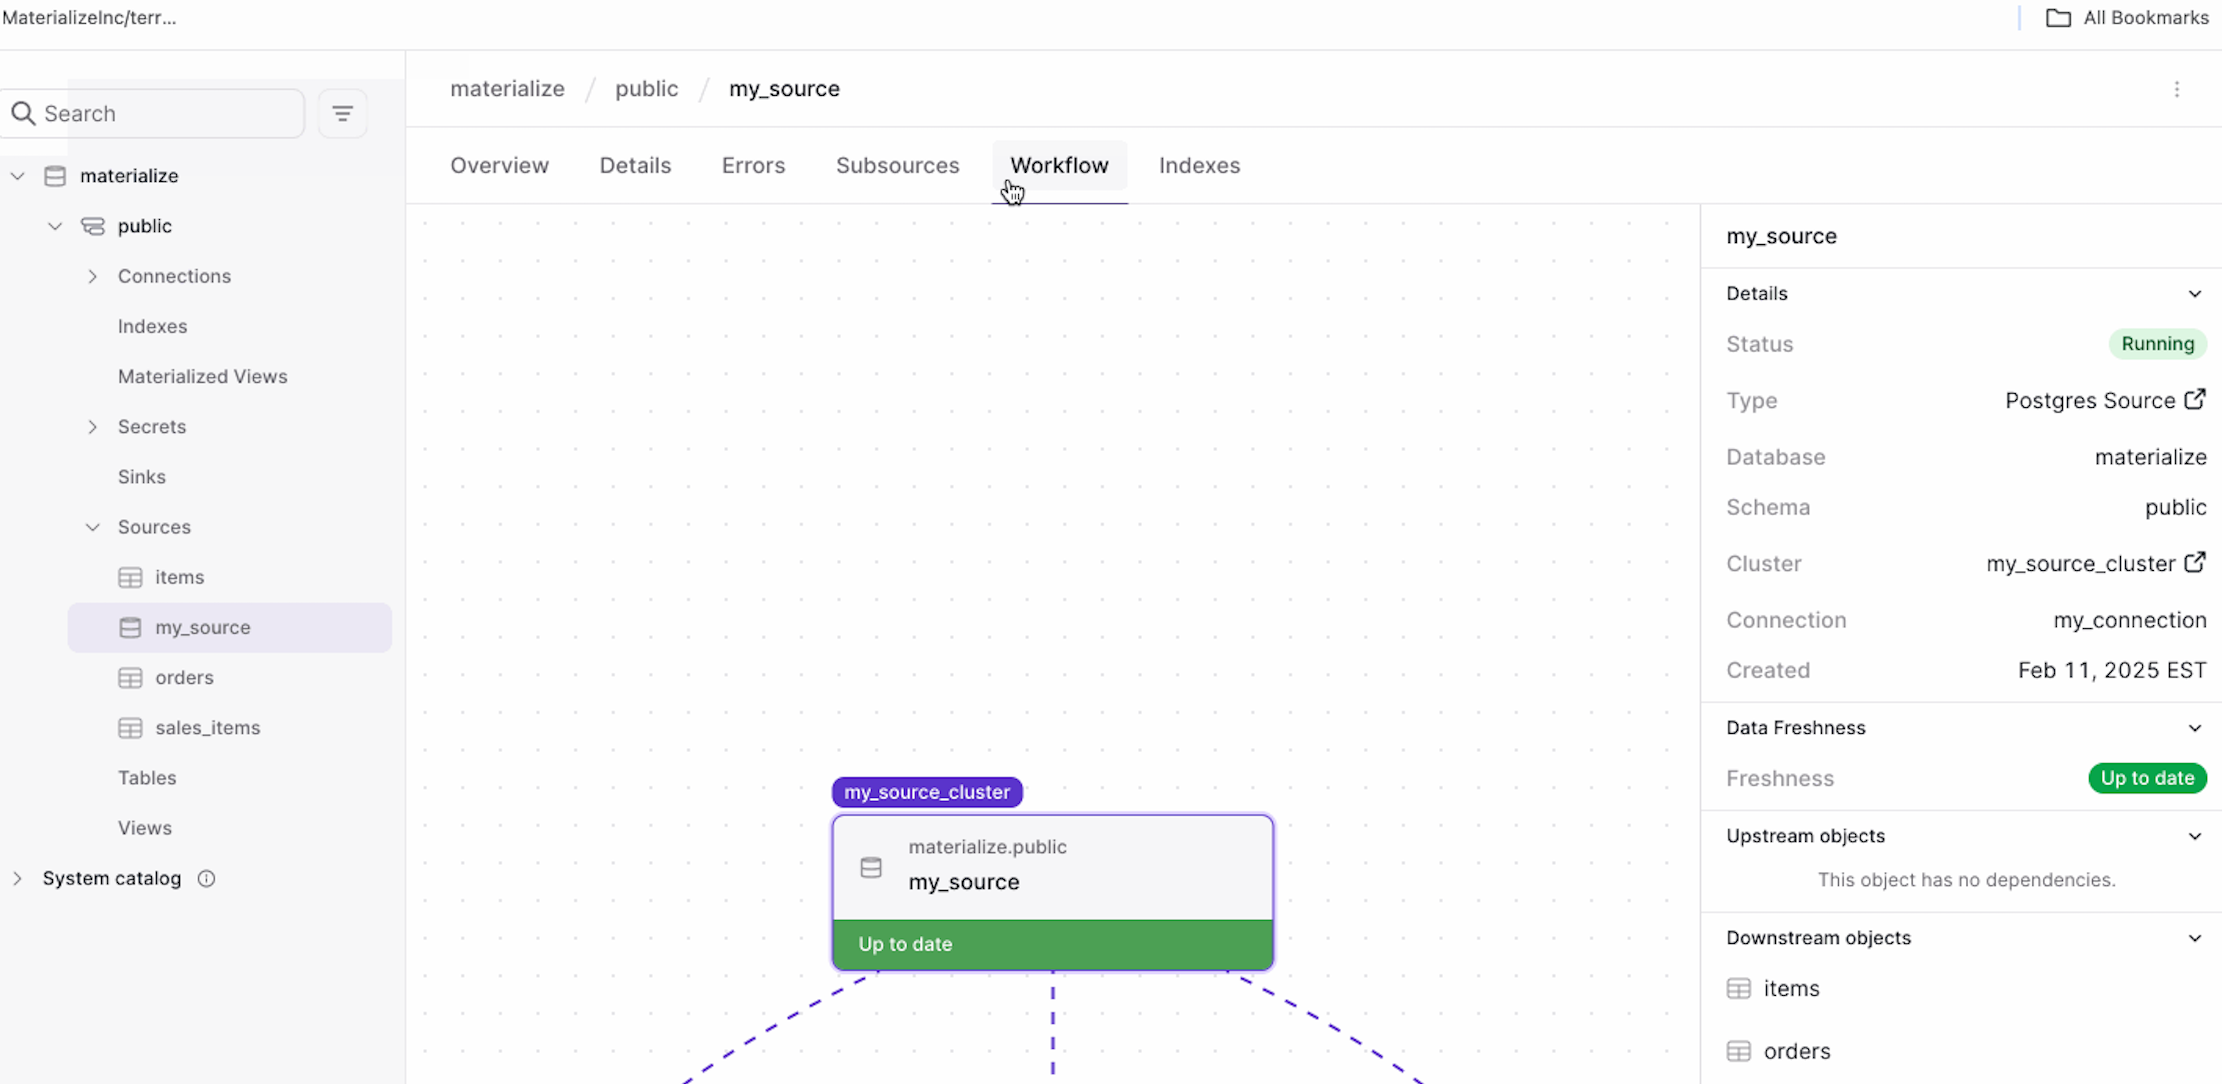
To monitor the hydration/data freshness status of a source (and its sub-sources), in the Materialize Console, you can go to the Workflow page of a source (or its sub-sources) to check for data freshness status; that is, whether the source is Up to date or Lagging. If lagging, the page also displays the lag amount.

Alternatively, you can run the following query:
SELECT
	s.name,
	h.hydrated
FROM mz_sources AS s
INNER JOIN mz_internal.mz_hydration_statuses AS h ON (s.id = h.object_id);
Monitoring data lag
In the Materialize Console, you can go to the Workflow page of a source (or its sub-sources) to check for data freshness status. If the source (or its sub-sources) is lagging, its Workflow page displays Lagging status as well as the lag amount.
Alternatively, the following query indicates the difference between the largest offset that is known from the external system and the last offset that has been processed (committed) by the source. The units depend on the source type. you want offset_delta to be close to 0.
SELECT
	o.name,
	o.id,
	s.offset_committed,
	s.offset_known,
	s.offset_known - s.offset_committed AS offset_delta
FROM mz_internal.mz_source_statistics AS s
INNER JOIN mz_objects AS o ON (s.id = o.id)
WHERE s.snapshot_committed;
Monitoring data ingestion progress
In the Materialize Console, you can go to the source overview page to view the data ingestion progress (e.g., rows_received, bytes_received, ingestion rate).
Alternatively, you can query the
mz_source_statistics
table and look for ingestion statistics that advance over time:
SELECT
    bytes_received,
    messages_received,
    updates_staged,
    updates_committed
FROM mz_internal.mz_source_statistics
WHERE id = <SOURCE_ID>;
You can also look at statistics for individual worker threads to evaluate whether ingestion progress is skewed, but it’s generally simplest to start by looking at the aggregate statistics for the whole source.
The bytes_received and messages_received statistics should roughly match the
external system’s measure of progress. For example, the bytes_received and
messages_received fields for a Kafka source should roughly match the upstream
Kafka broker reports as the number of bytes (including the key) and number of
messages transmitted, respectively.
During the initial snapshot, updates_committed will remain at zero until all
messages in the snapshot have been staged. Only then will updates_committed
advance. This is expected, and not a cause for concern.
After the initial snapshot, there should be relatively little skew between
updates_staged and updates_committed. A large gap is usually an indication
that the source has fallen behind, and that you likely need to scale it up.
messages_received does not necessarily correspond with updates_staged
and updates_commmited. For example, a source with ENVELOPE UPSERT can have more
updates than messages, because messages can cause both deletions and insertions
(i.e. when they update a value for a key), which are both counted in the
updates_* statistics. There can also be fewer updates than messages, as
many messages for a single key can be consolidated if they occur within a (small)
internally configured window. That said, messages_received making
steady progress while updates_staged/updates_committed doesn’t is also
evidence that a source has fallen behind, and may need to be scaled up.
Beware that these statistics periodically reset to zero, as internal components of the system restart. This is expected behavior. As a result, you should restrict your attention to how these statistics evolve over time, and not their absolute values at any moment in time.