Ingestion performance
View as MarkdownThis page provides an overview of ingestion performance from internal benchmarks, so you can assess Materialize against a specific workload, size a cluster, and estimate cost. The results show that Materialize sustains fresh data with high throughput and predictable load on upstream systems. For the full test methodology and results, see the ingestion performance litepaper.
Benchmarks
We run five benchmarks spanning the lifecycle of a typical Materialize installation, from bringing a new source online, to running in steady state, to scaling up load and the number of clusters. We run each benchmark across PostgreSQL, MySQL, SQL Server, and Kafka, using Materialize’s default isolation level of strict serializability.
Snapshot time
- Test: How long the initial snapshot of a newly connected source takes to complete.
- Method: We create a source and snapshot 1 to 4 tables (topics for Kafka), each holding 100 million records (about 10 GB), using a 400cc Materialize cluster.
- Results: Snapshotting four tables takes about 5 to 26 minutes depending on the source. Snapshot time depends on cluster size and the upstream system, with Kafka upsert sources being more resource intensive.
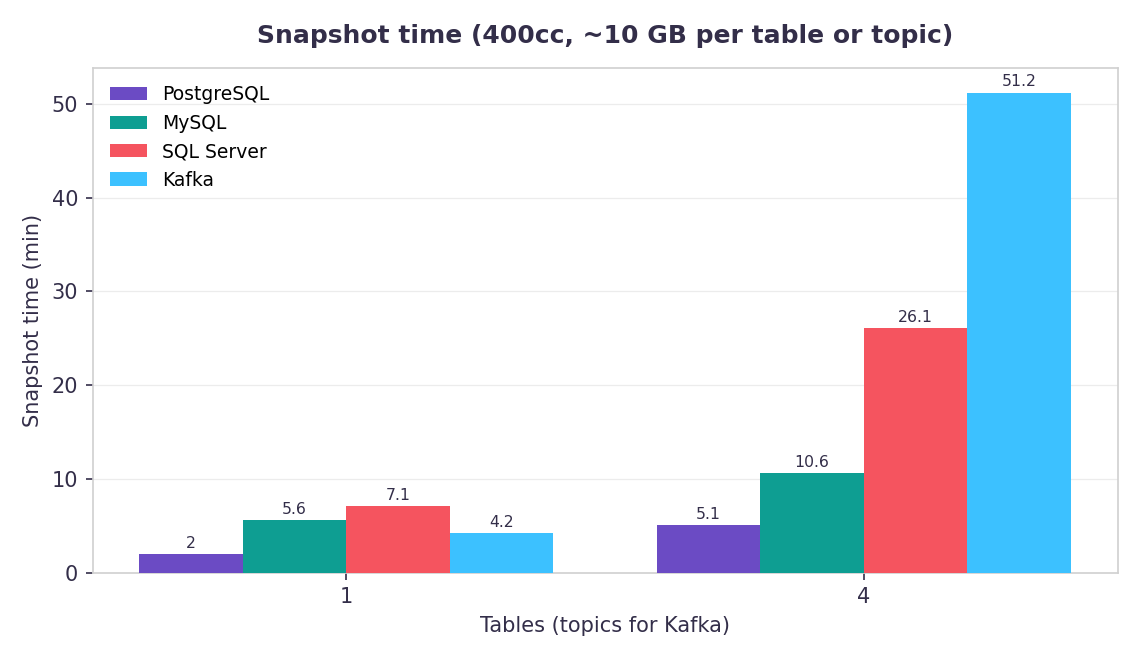
Snapshot time (minutes) by table count (topics for Kafka).
| Source | 1 | 4 |
|---|---|---|
| PostgreSQL | 2.0 | 5.1 |
| MySQL | 5.6 | 10.6 |
| SQL Server | 7.1 | 26.1 |
| Kafka | 4.2 | 51.2 |
Snapshot load
- Test: The load the snapshot places on the upstream system while it runs.
- Method: We create a source and snapshot 1 to 4 tables (topics for Kafka), each holding 100 million records (about 10 GB), recording the upstream system’s peak CPU, egress, and memory, using a 400cc Materialize cluster.
- Results: When snapshotting four tables, peak CPU stays between about 7% and 21% depending on the source, and the load is mostly CPU and egress.
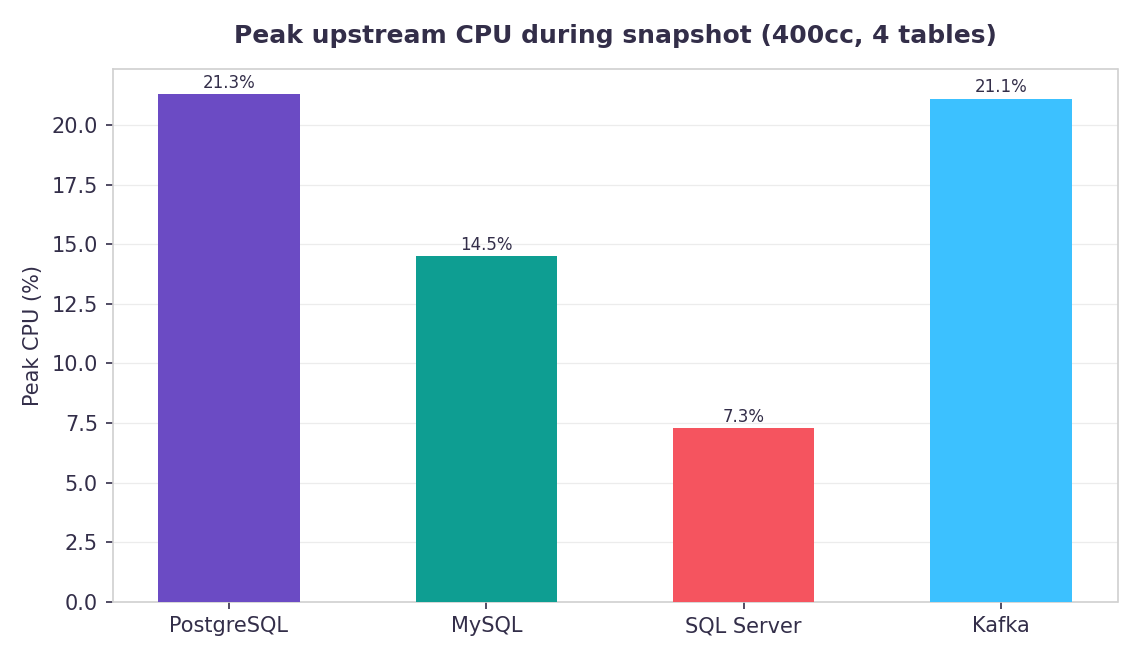
Peak upstream load at four tables (topics for Kafka).
| Source | Peak CPU | Egress |
|---|---|---|
| PostgreSQL | 21.3% | 204 MB/s |
| MySQL | 14.5% | 83 MB/s |
| SQL Server | 7.3% | 30 MB/s |
| Kafka | 21.1% (broker) | 73 MB/s (combined) |
Sustained throughput
- Test: How much data Materialize can ingest from a single source while keeping it fresh.
- Method: We use a k6 load generator with 1 to 16 parallel writers, each writing as fast as the source accepts, using a 400cc Materialize cluster.
- Results: Throughput reaches 43,000 to 117,000 rows a second across all sources (messages for Kafka), with p99 freshness around 1 to 2.5 seconds apart from SQL Server, which lags as its poll-based CDC falls behind.
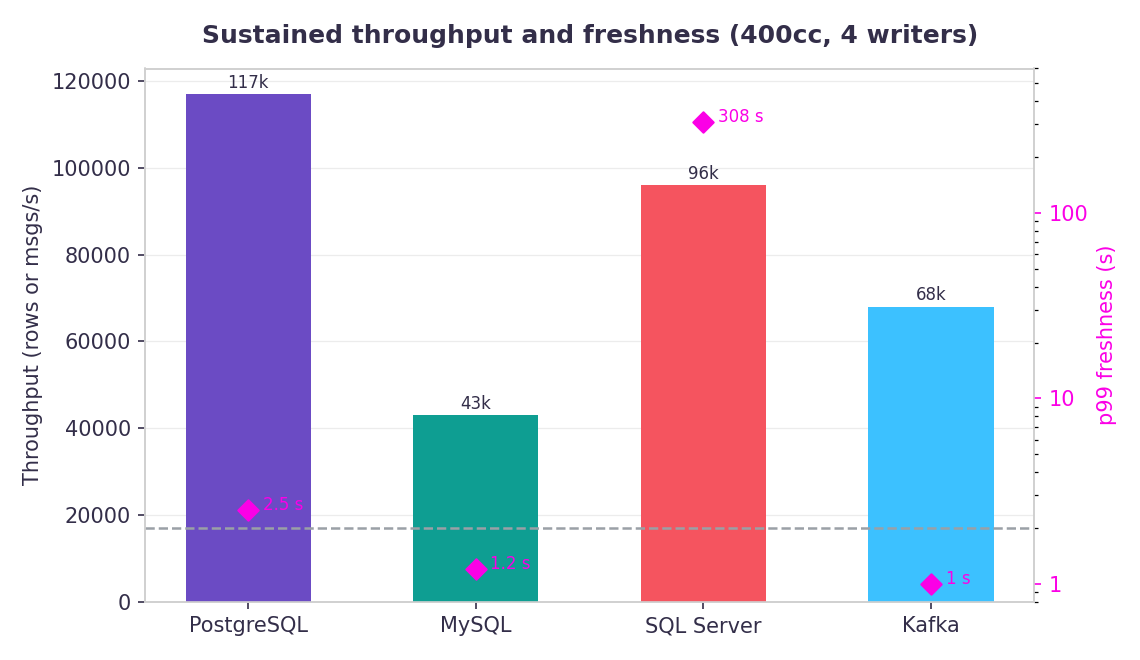
Throughput and p99 freshness at four parallel writers.
| Source | Throughput | p99 freshness |
|---|---|---|
| PostgreSQL | ~117,000 rows/s | 2.5 s |
| MySQL | ~43,000 rows/s | 1.2 s |
| SQL Server | ~96,000 rows/s | 308 s |
| Kafka | ~68,000 msgs/s | 1 s |
Vertical scaling
- Test: How many tables a single Materialize cluster keeps fresh at once.
- Method: We use a k6 load generator with 16 writers, each writing as fast as the source accepts, increasing the number of tables from 1 to 100, using a 400cc Materialize cluster.
- Results: Freshness holds around 1 to 2 seconds from 1 to 100 tables for most sources, apart from SQL Server, which lags as its poll-based CDC falls behind.
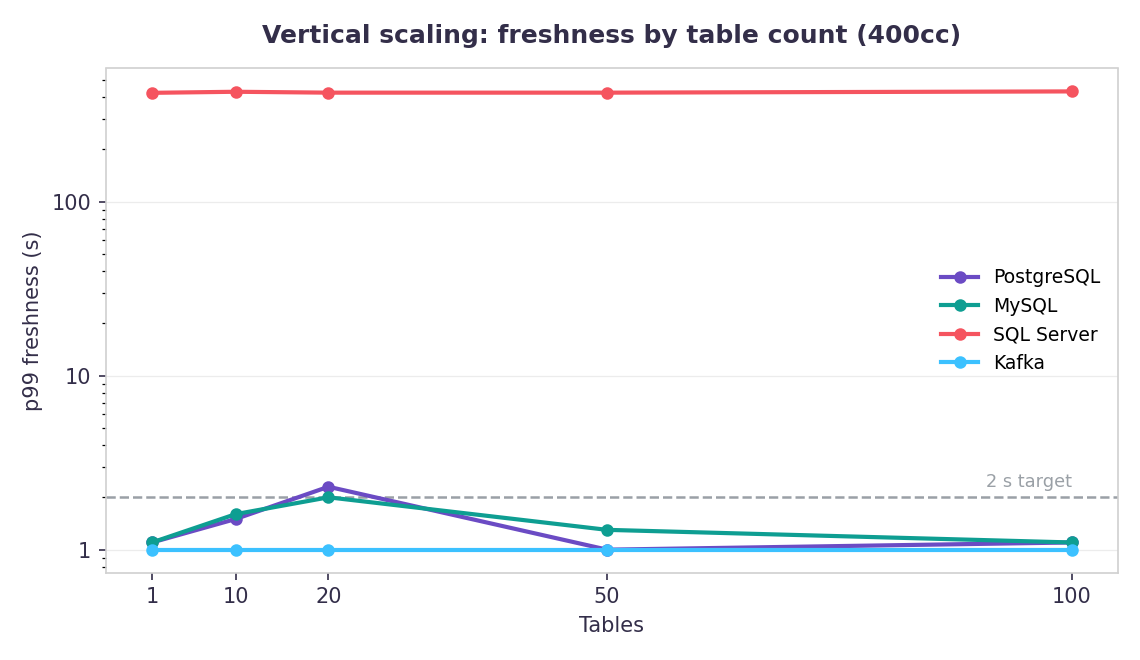
p99 freshness by table count (topics for Kafka).
| Tables | PostgreSQL | MySQL | SQL Server | Kafka |
|---|---|---|---|---|
| 1 | 1.1 s | 1.1 s | 423 s | 1 s |
| 10 | 1.5 s | 1.6 s | 429 s | 1 s |
| 20 | 2.3 s | 2.0 s | 424 s | 1 s |
| 50 | 1.0 s | 1.3 s | 424 s | 1 s |
| 100 | 1.1 s | 1.1 s | 431 s | 1 s |
Horizontal scaling
- Test: How freshness holds as more Materialize clusters read from the same upstream system.
- Method: We use a k6 load generator with a single writer writing as fast as the source accepts, increasing the number of 800cc Materialize clusters reading it from 1 to 32.
- Results: Freshness holds steady out to 32 clusters for most sources, apart from Kafka, which rises to 5 seconds at the largest fan-out.
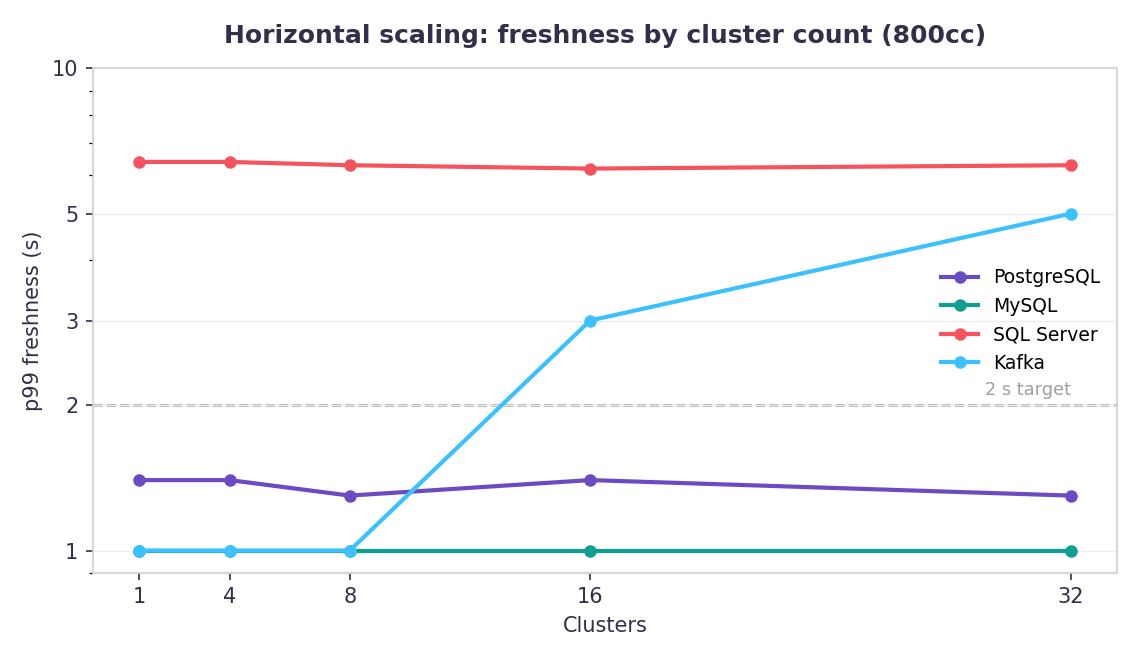
p99 freshness by cluster count, at 10 tables per cluster (topics for Kafka).
| Clusters | PostgreSQL | MySQL | SQL Server | Kafka |
|---|---|---|---|---|
| 1 | 1.4 s | 1.0 s | 6.4 s | 1 s |
| 4 | 1.4 s | 1.0 s | 6.4 s | 1 s |
| 8 | 1.3 s | 1.0 s | 6.3 s | 1 s |
| 16 | 1.4 s | 1.0 s | 6.2 s | 3 s |
| 32 | 1.3 s | 1.0 s | 6.3 s | 5 s |
Methodology
We use different test methods for the snapshot and continuous ingestion benchmarks. The snapshot benchmarks run against a fixed dataset already in the upstream system, which Materialize ingests until the snapshot completes. The throughput and scaling benchmarks use a k6 load generator to write into the upstream system as Materialize ingests, with each configuration running for ten minutes.
We measure freshness differently for databases and Kafka, due to differences in how each operates:
- Databases: we inject marker rows through the same source as the workload, timing how long each takes from being written to appearing in Materialize.
- Kafka: we use Materialize’s reported wallclock lag on the workload table, measured in whole seconds.
We run these benchmarks on every release. The figures here are from Materialize v26.20.2 (EKS), with each source on a managed AWS service:
| System | Instance |
|---|---|
| k6 load generator | c7g.4xlarge |
| PostgreSQL 18 | db.r6g.2xlarge |
| MySQL 8.4 | db.r6g.2xlarge |
| SQL Server 2022 | db.r6i.4xlarge |
| Kafka (Amazon MSK 3.6) | kafka.m5.large (snapshot and throughput benchmarks), kafka.m5.4xlarge (scaling benchmarks); 3 brokers |